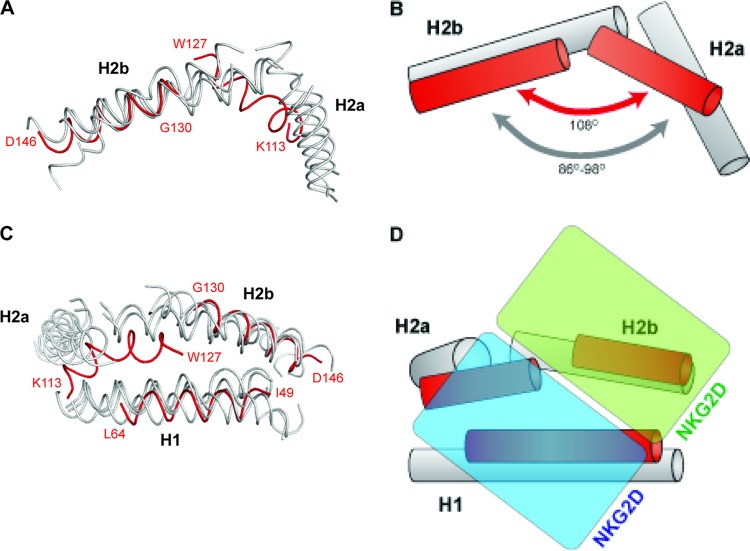
Fig 4.
Comparison of H1, H2a, and H2b between OMCP and host NKG2DLs. (A) Side view of OMCP helices (red) overlaid with host NKG2DL helices (MICA [1HYR[, MICB [1JE6], ULBP3 [1KCG], and RAE-1β [1JFM]) (gray). (B) Cartoon model showing the distinct helical angle for OMCP. (C) Top view of OMCP helices (red) overlaid with host NKG2DL helices (gray). (D) Cartoon model with each half of the NKG2D dimer (cyan and green) shown in the same orientation used to bind host NKG2DLs.

