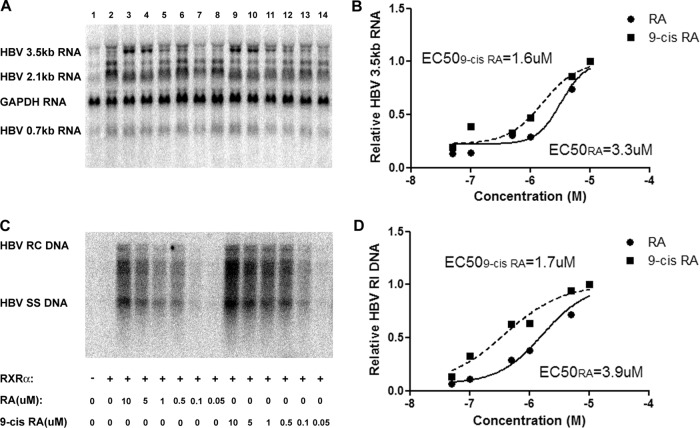
Fig 2.
Effect of all-trans-retinoic acid and 9-cis-retinoic acid concentrations on HBV biosynthesis in the human embryonic kidney cell line 293T expressing RXRα. Cells were transfected with the HBV DNA (4.1-kbp) construct alone (lane 1) or the HBV DNA (4.1-kbp) construct plus the RXRα expression vector (lanes 2 to 14) as indicated. Cells were treated with various concentrations of all-trans-retinoic acid (0.05 to 10 μM RA; lanes 3 to 8) and 9-cis-retinoic acid (0.05 to 10 μM 9-cis-RA; lanes 9 to 14). (A) RNA (Northern) filter hybridization analysis of HBV transcripts. The glyceraldehyde-3-phosphate dehydrogenase (GAPDH) transcript was used as an internal control for RNA loading per lane. (B) Quantitative analysis of the HBV 3.5-kb RNA from two independent experiments. Trend lines were calculated using GraphPad Prism 5 software to determine the sigmoidal dose response (variable slope) curve plus 50% effective concentrations (EC50s). (C) DNA (Southern) filter hybridization analysis of HBV replication intermediates. HBV RC DNA, HBV relaxed circular DNA; HBV SS DNA, HBV single-stranded DNA. (D) Quantitative analysis of the HBV replication intermediates from two independent experiments. Trend lines were calculated using GraphPad Prism 5 software to determine the sigmoidal dose response (variable slope) curve plus EC50s.

