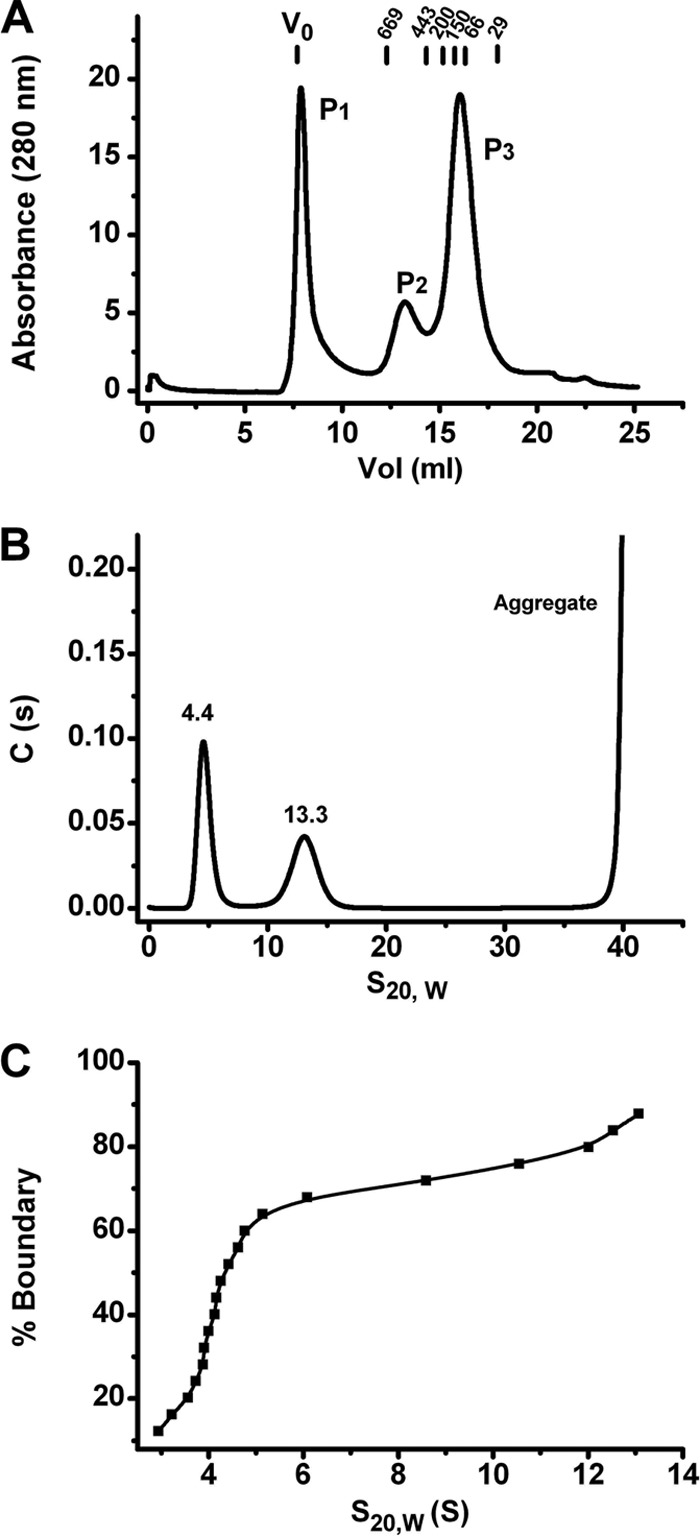
Fig 1.

Rep68 wt oligomerization profile. (A) Rep68 wt (2 mg/ml) was injected in a Superose 6 10/300 GL column with a flow rate of 0.5 ml/min. Protein elution was followed by UV detection at 280 nm. The x axis represents the elution volume. Molecular mass standards are shown above the plot. (B) Sedimentation velocity profiles of Rep68 wt at a concentration of a 0.5 optical density (0.33 mg/ml). The experiment was run at 40,000 rpm and 20°C, as described in Materials and Methods. (C) van Holde-Weischet analysis of the sedimentation velocity data shown in panel B. The spread from the vertical at both 4S and 13S indicates the presence of more than one species in each population.
