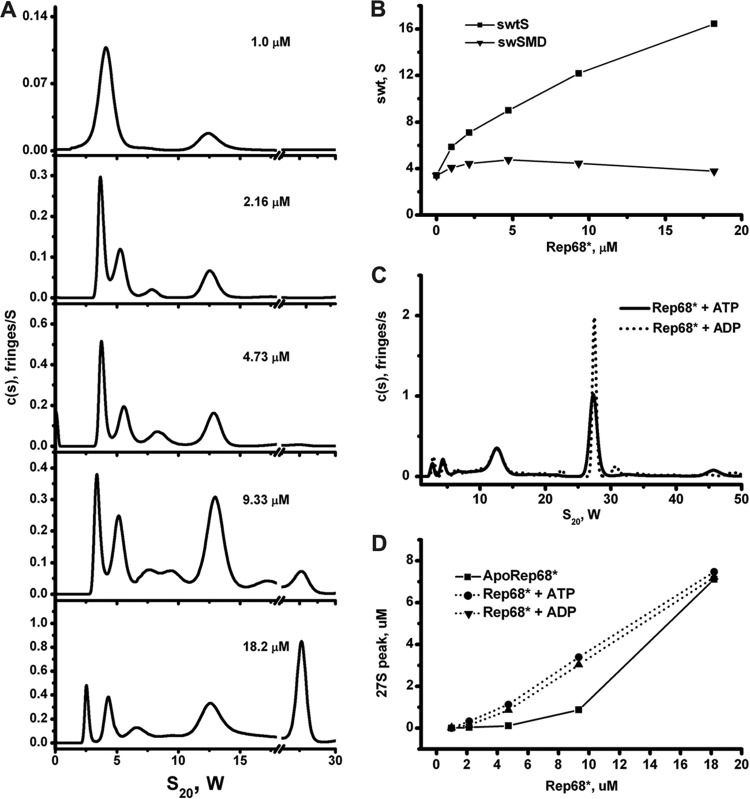
Fig 5.
Sedimentation velocity analysis of Rep68*. (A) Sedimentation profiles of Rep68* at five different concentrations obtained using the SEDFIT program. The corresponding values for molecular mass and s20,w are shown in Table 2. (B) Dependence of the weight average sedimentation coefficient on Rep68* loading concentration. ■, weight average sedimentation coefficient for the entire distribution; ▼, weight average for the dimer-monomer equilibrium. (C) Different concentrations of Rep68* (from 1 to 18 μM) were tested in sedimentation analysis assays in the absence or in the presence of nucleotides of ADP and ATP. A final 1 mM concentration of these nucleotides was used in every sedimentation velocity run. (D) Effect of ATP/ADP on the amount of 27S species formed. The area under the 27S peak was integrated at each concentration.

