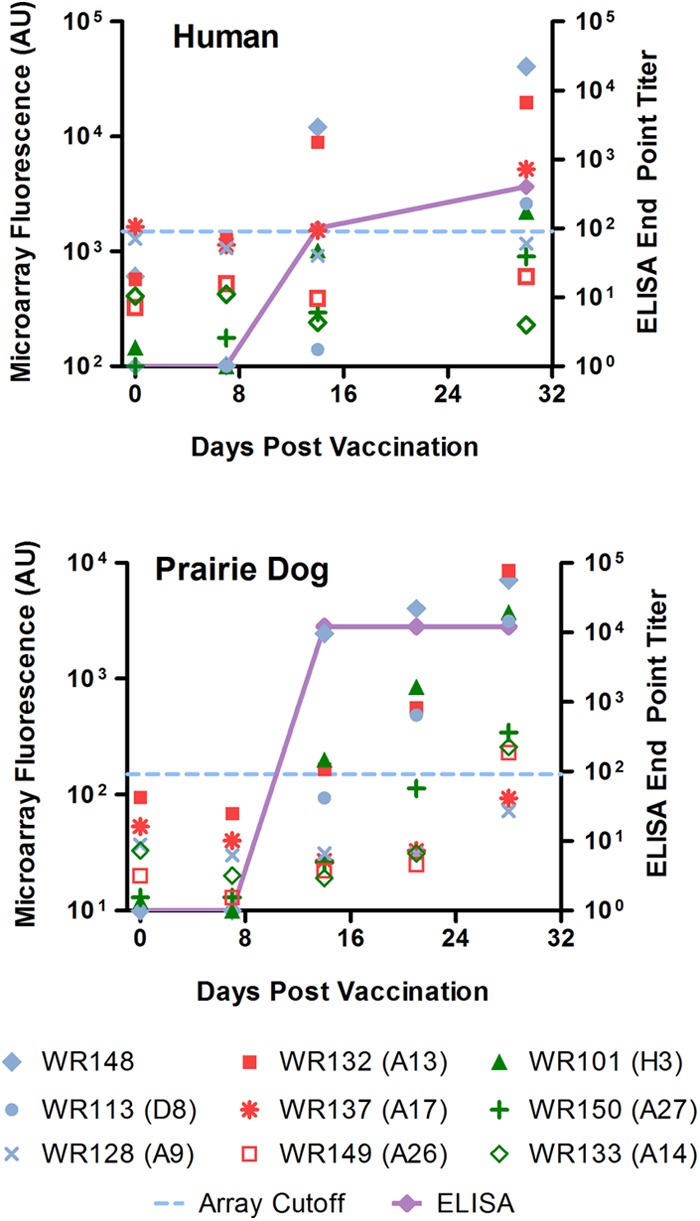
Fig 3.

Kinetic view of responses to MV proteins at days 0, 7, 14, 21, and 28 or 30 and correlation with ELISA results; shown are data for an Acam200-vaccinated human and a Dryvax-vaccinated prairie dog. Raw microarray signal intensities for select MV surface proteins are plotted, along with the array cutoff (dashed blue lines) and endpoint titer ELISA values (solid purple lines). The data are typical for each species regardless of the vaccination strain.
