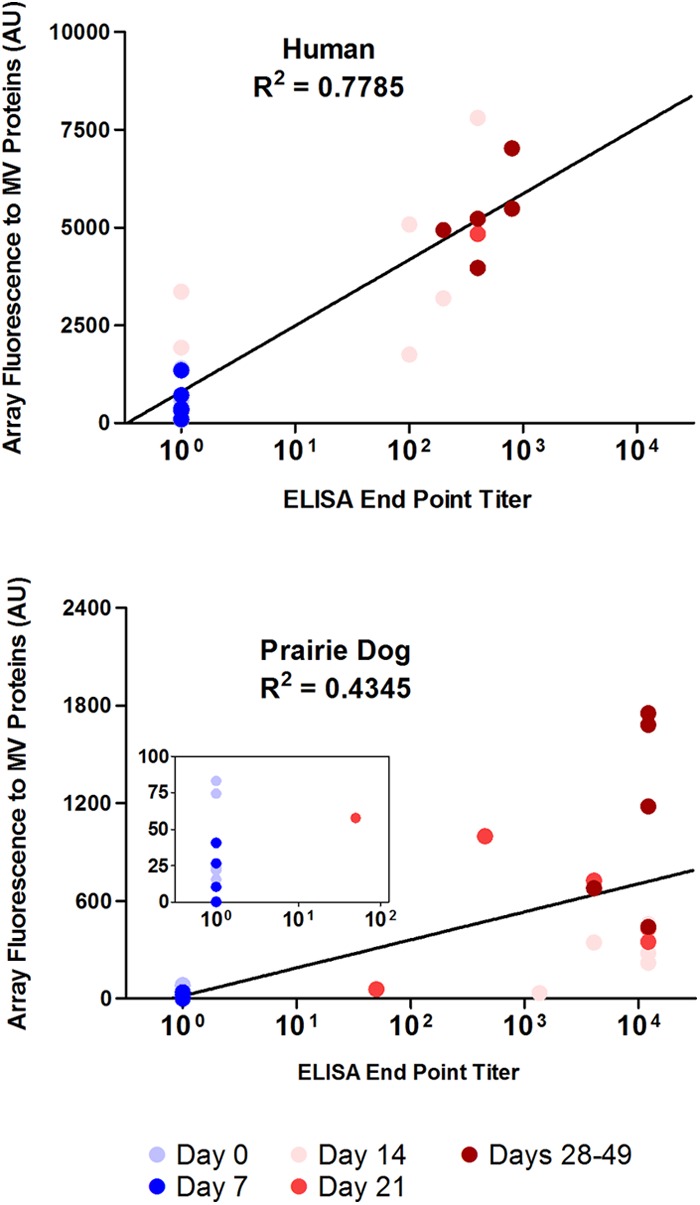
Fig 4.

Microarray fluorescence in response to MV proteins correlates with the ELISA endpoint antibody titer. The intensities for all MV proteins present on the array were analyzed at days 0, 7, 14, and 21 to 49 after Dryvax or Acam2000 vaccination of humans (n = 6) and prairie dogs (n = 6) and compared with the corresponding ELISA titers. The data points are shown in color and represent the date of sampling, i.e., days 0, 7, 14, 21, and 29 to 49. The inset in the prairie dog graph shows a close-up view of the data with a 100 ELISA endpoint titer. Data for all time points were not available for all individuals.
