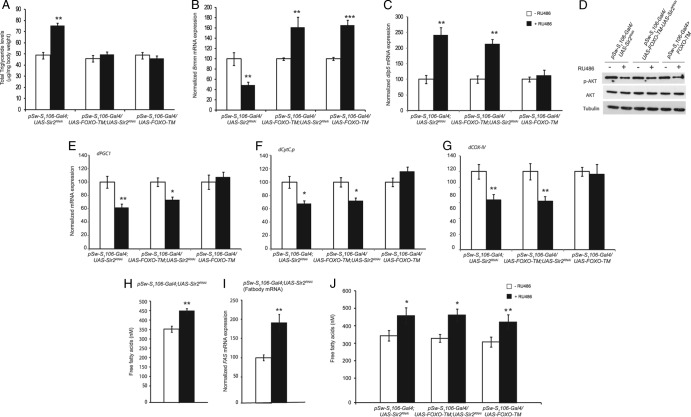
Fig 7.
Fat body dFOXO-TM overexpression in the absence of dSir2 rescues triglyceride levels but not muscle insulin signaling defects. As indicated on the figure, data are for fat body-specific dSir2 knockdown (pSw-S1106-Gal4; UAS-Sir2RNAi), fat body-specific overexpression of dFOXO-TM (pSw-S1106-Gal4/UAS-dFOXO-TM), and simultaneous fat body-specific knockdown and overexpression of dSir2 and dFOXO-TM (pSw-S1106-Gal4/UAS-FOXO-TM; UAS-Sir2RNAi). (A) Total triglyceride levels. (B) Expression of brummer lipase. (C) Relative expression of dilp-5 in head sample. (D) p-Akt levels in muscle samples. Relative mRNA expression levels of dPGC1 (E), dCyt.C-p (F), and dCOX-IV (G) in muscle samples are shown. (H and J) Circulating free fatty acid levels. (I) Relative mRNA expression of fatty acid synthase in the fat body. Sample sizes were 16 flies for phospho-AKT levels and 60 flies for analysis of the expression levels of genes. For free fatty acid measurement eight sets with five flies were used. Control, −RU486; overexpression/knockdown, +RU486 (200 μM or 400 μM, for driving single or double UAS genes). All data are shown as means ± standard errors of the means. *, P < 0.05; **, P < 0.01; ***, P < 0.001.

