Fig 1.
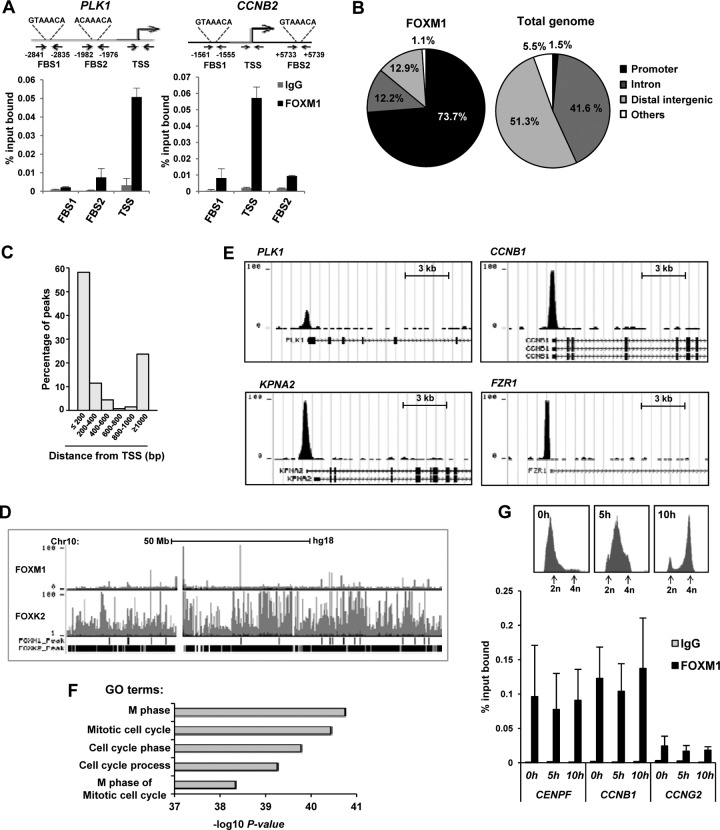
FOXM1 binds to the promoter regions of genes involved in late cell cycle control. (A) ChIP analysis of FOXM1 binding to the PLK1 and CCNB2 promoters in asynchronously growing U2OS cells, using the indicated primer pairs. (B) Distribution of FOXM1 ChIP-seq regions (left) compared to the total genomic DNA distribution (right). The sector corresponding to the promoter includes sequences up to 1 kb upstream from the TSS or in the 5′ UTR. (C) Distribution of peaks summit distances from the TSS. (D) Screenshot from the UCSC browser showing the distribution of FOXM1 and FOXK2 binding peaks in U2OS cells across chromosome 10. (E) Example FOXM1 binding peak profiles for the indicated genes. (F) The top five overrepresented gene ontology (GO) terms in genes associated with FOXM1 binding regions. (G) ChIP analysis of FOXM1 binding to the PLK1 and CCNB2 promoters in U2OS cells released from a double thymidine block for the indicated times, using the indicated primer pairs. DNA content profiles of U2OS cells at the indicated time points following release from a double thymidine block are shown above the graph. DNA content is determined by propidium iodide (PI) staining and peaks corresponding to cells before (2n) and after (4n) DNA replication are shown.

