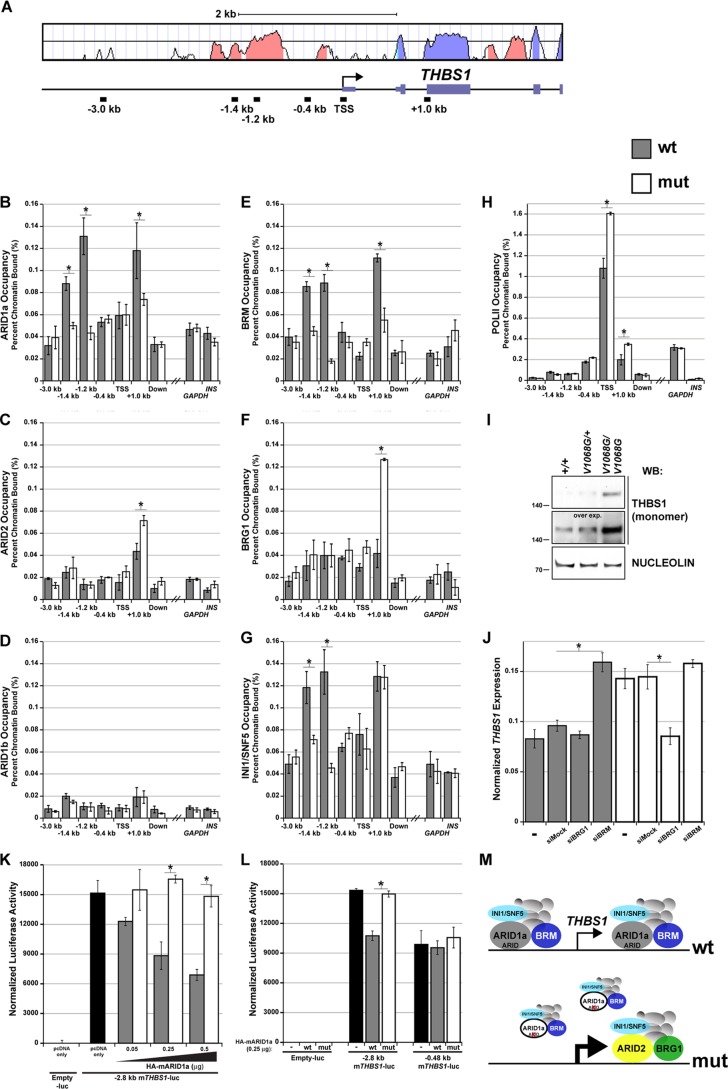
Fig 8.
The ARID domain of ARID1a is required for BAF-A occupancy at THBS1. (A) Mouse/human VISTA alignment of the THBS1 promoter and 5′ transcribed region. Salmon-colored peaks denote evolutionarily conserved regions, whereas lavender peaks denote exons. The locations of ChIP amplicons within this interval are plotted. (B to H) Formaldehyde-cross-linked chromatin from wild-type and Arid1aV1068G/V1068G MEFs was immunoprecipitated with ARID1a, ARID1b, ARID2, BRG1, BRM, INI1/SNF5, or Pol II antibodies. DNA was amplified by quantitative PCR to determine if loss of ARID-DNA binding leads to changes in BAF-A occupancy across THBS1. An intergenic, nonconserved downstream region (located at approximately kb +20) and two unlinked promoter control elements (GAPDH and INS-1) were used as negative genomic controls. Data were plotted as the percentage of total input or chromatin bound. (I) Whole-embryo protein lysates from triplicate pooled samples were used to examine THBS1 protein (reduced, monomeric form) expression differences by Western blotting. An overexposed image of the Western blot was also included to further emphasize these expression differences. The constitutive nuclear matrix protein, nucleolin, was used as a loading control. (J) cDNA synthesized from RNA isolated from wild-type or Arid1aV1068G/V1068G MEFs was used in a quantitative PCR to examine THBS1 expression differences following transfection with mock (nontargeting control), BRG1, or BRM siRNA. (K) Normalized luciferase activity of the THBS1 −2.8 kb promoter-luciferase fragment cotransfected with 0.05 to 0.5 μg of wild-type or mutant HA-mARID1a expression plasmids into NIH 3T3 cells. Cells cotransfected with the empty luciferase vector (−luc) or THBS1 −2.8 kb promoter-luciferase fragment and with empty pcDNA expression plasmids served as negative and positive controls, respectively. (L) Normalized luciferase activity of THBS1 −2.8 kb and −0.48 kb promoter-luciferase reporter plasmids cotransfected with 0.25 μg of pcDNA only (−) or wild-type or mutant HA-mARID1a expression plasmids. Empty luciferase reporter plasmid was used as a negative control. (M) Summary model of ChIP and expression data. Error bars in panels B to H and in panel J represent the SEMs. Error bars in panels K and L represent the standard deviations. Significant differences were calculated using a two-tailed Student t test (*, P < 0.05).

