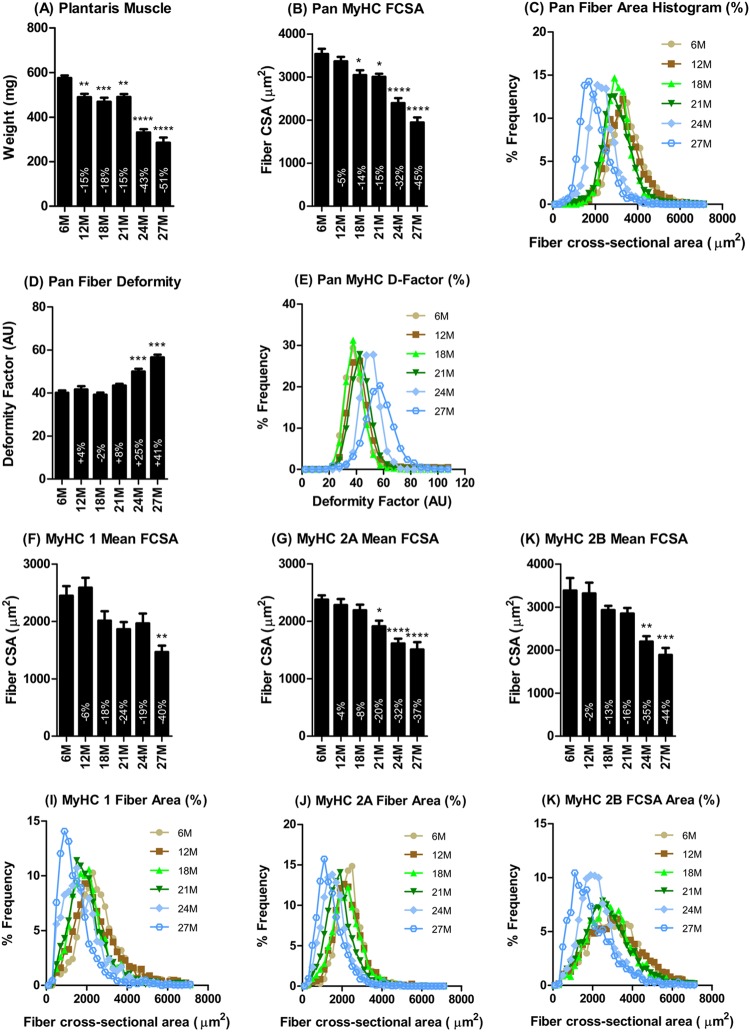
Fig 2.
Plantaris muscle fiber histomorphometry. The age-dependent decline in plantaris muscle mass (A) was associated with a proportional decrease in fiber cross-sectional area (B), a leftward shift of the fiber cross-sectional area histogram (C), and increased deformation of fibers (D and E). Analysis of the individual fiber types indicated no significant differences in the degree (F and G) or patterns (I to K) of atrophy between types 1, 2A, and 2B fiber types. *, **, ***, and **** indicate P < 0.05, 0.01, 0.001, 0.0001 versus 6 months, respectively. 6M, 6 months; 12M, 12 months, etc.

