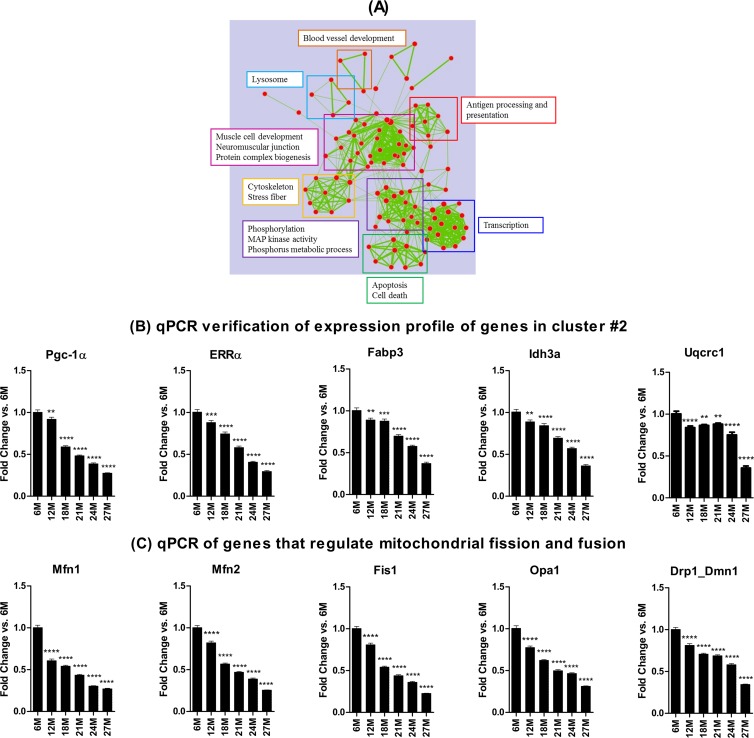
Fig 5.
Map of enriched gene sets for genes in cluster 2 based on DAVID output. Each node represents a gene set. Clusters of functionally related gene sets were manually framed and summarized into key findings in the text frame with the same color. (A) Functional annotation analysis of the genes in cluster 2 indicates that pathways and processes involved in energy metabolism are depressed in sarcopenia. (B) Quantitative PCR analyses verified downregulation of some genes in cluster 2 and other genes involved in energy metabolism (B) and mitochondrial dynamics (C). *, **, ***, and **** indicate P < 0.05, 0.01, 0.001, and 0.0001 versus 6 months, respectively. 6M, 6 months; 12M, 12 months, etc.

