
Fig 5.
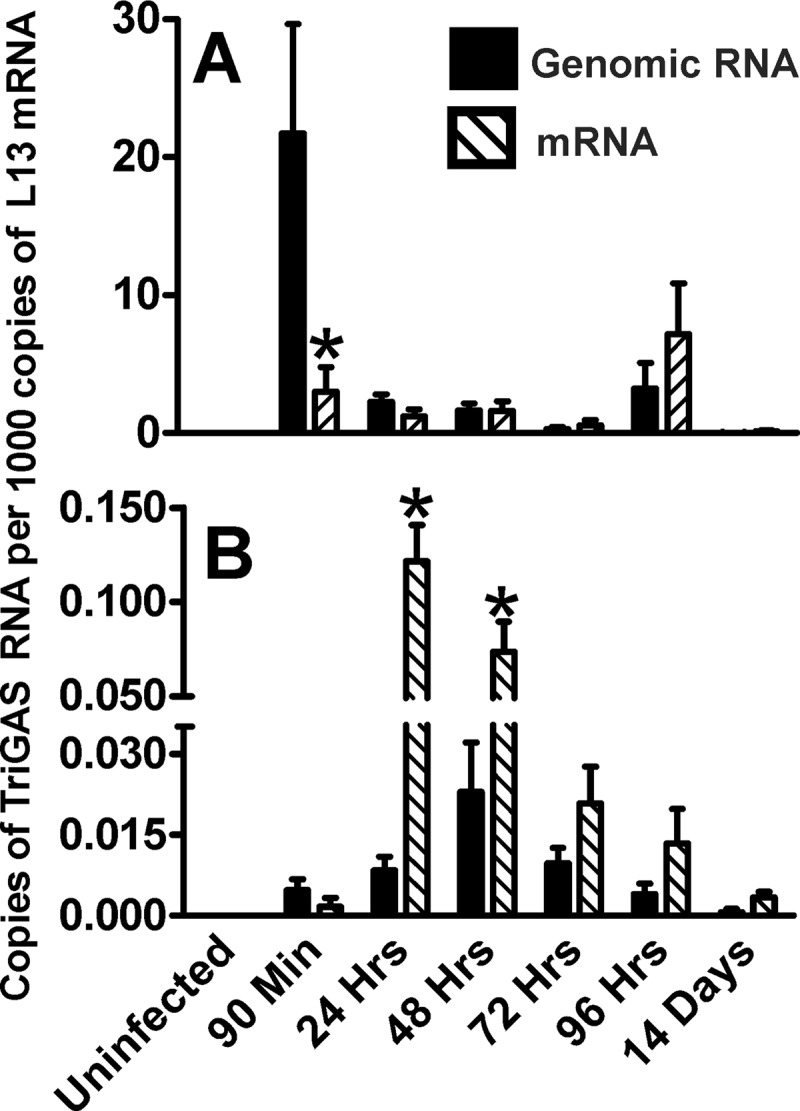
Comparison of the expressions of genomic RABV N RNA and RABV N mRNA in muscle tissue (A) and draining lymph node tissue (B) after inoculation of 107 FFU TriGAS into the gastrocnemius muscle. Muscle and lymph node tissue were collected at the indicated times after TriGAS inoculation. After isolation of total RNA from the different tissues, genomic RABV RNA and RABV N mRNA were analyzed by qRT-PCR and the amounts of RABV RNAs were normalized to the amounts of L13 mRNA detected in the different tissues as described in Materials and Methods. Expression values are presented as the means (± SE) of copy numbers of genomic RABV RNA or RABV mRNA per 1,000 copies of L13 mRNA. Significant differences in expression of genomic RABV RNA and RABV mRNA are indicated as follows: *, P < 0.05.