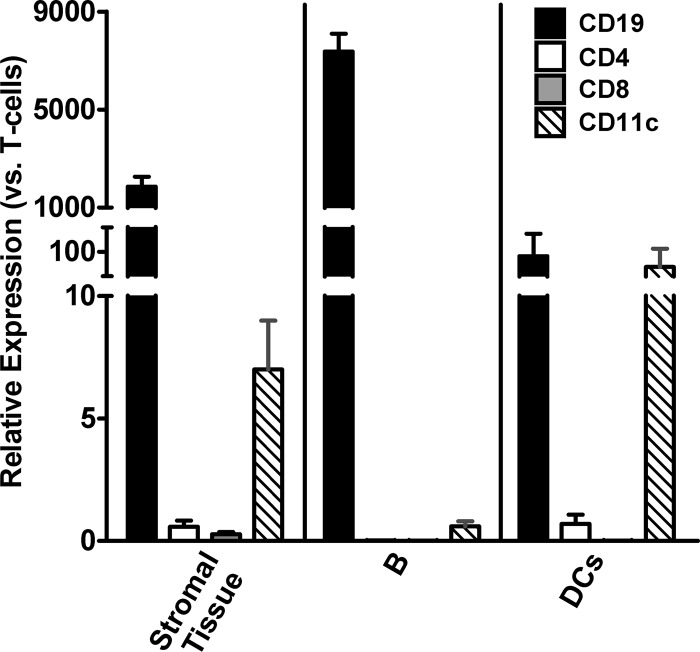
Fig 6.
Expression of mRNA specific for the CD19-, CD4-, CD8-, and CD11c-specific mRNA biomarkers in isolated B cells, DCs, and stroma. Forty-eight hours after inoculation of 107 FFU of TriGAS into the gastrocnemius muscle, different cell populations were isolated from the draining lymph node and the relative fold changes of mRNA levels were determined by qRT-PCR analysis using the comparative threshold cycle (CT) method. The amounts of mRNAs for the different biomarkers, which were normalized to the expression levels of L13 mRNA, are presented as the means (± SE) of fold increases in mRNA expression.

