
Fig 3.
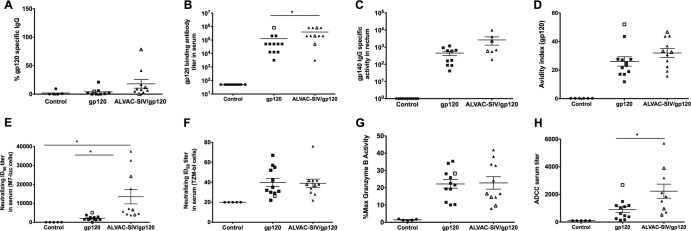
Vaccine-induced B-cell responses. All data presented in the figure were obtained from sera collected at week 27, 3 weeks after the last immunization. In all the figures, the animals protected from SIV acquisition are depicted with open symbols, and the horizontal bars in the figures represent the average values and standard errors. (A) Percentages of gp120-specific IgG of the total cell-producing IgG at week 27. (B) Endpoint titers of SIV Env-specific IgG in serum of animals vaccinated with ALVAC-SIV/gp120, SIV gp120, or controls. (C) Gp140 IgG-specific activity in rectal secretions from vaccinated animals and controls. (D) Avidity of antibodies to the SIVmac239 Env protein in sera of the animals vaccinated with either ALVAC-SIV/gp120 or SIV gp120 or controls. SIV-specific neutralization activity measured in animal sera using SIV pseudotyped lentiviruses and either the M7-luc cell line (E) or TZM-bl cells (F) as targets. ADCC capacity of antibodies in serum of all animals represented as the percent maximum granzyme activity (G) or serum ADCC titer (H).