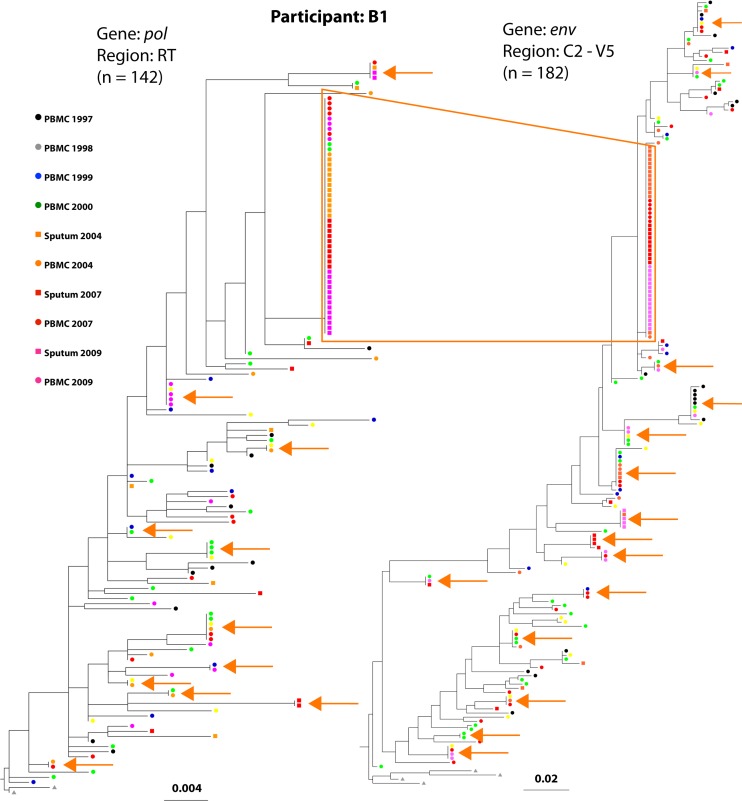
Fig 2.
Phylogenetic trees of participant B1's HIV sequences demonstrate a large cluster of monotypic sequences. The phylogenetic trees were modeled on pol and env sequences from participant B1, who had the largest cluster of monotypic sequences (box outlined in orange). The tree constructed with pol sequences encoding reverse transcriptase is shown on the left, and the env tree is shown on the right. The tips of the trees are color coded to correspond to the dates and tissue source (see key). Concordant env and pol sequences, generated from the same multiplexed first-round reaction of the specimen diluted beyond a single template per reaction (single genome amplification), comprised 57% of the sequences in the largest monotypic cluster. Smaller clusters of monotypic sequences are indicated with orange arrows.

