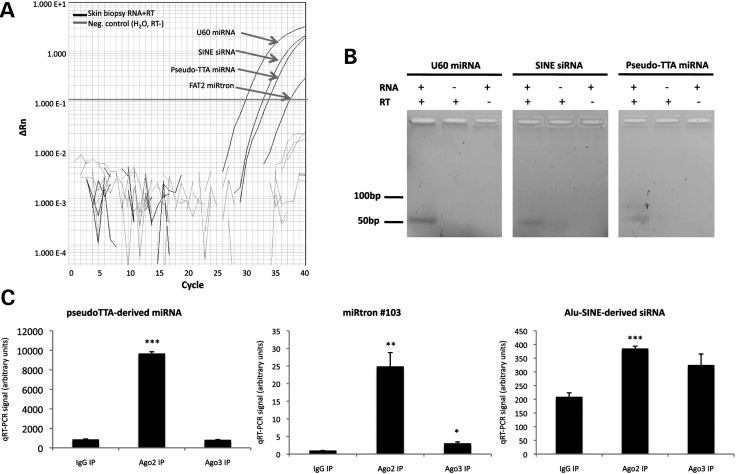
Figure 3.
Endogenous expression of mature novel miRNAs in skin. (A) qRT–PCR amplification traces of sncRNAs from human skin biopsy RNA (black lines) and negative controls (gray lines). An arbitrary threshold used for relative quantitation of expression levels (not shown) is indicated in green. (B) qRT–PCR product bands from human skin biopsy RNA and negative controls. A band size of ∼50 bp corresponds to an ∼21 nt RNA species due to the addition of arbitrary sequence during the reverse transcription step (see Materials and Methods). (C) Abundance of sncRNAs in AGO2 and AGO3 immunoprecipitates relative to IgG. (*P < 0.05, **P < 0.01, ***P < 0.001). RT, reverse transcriptase.

