Fig 2.
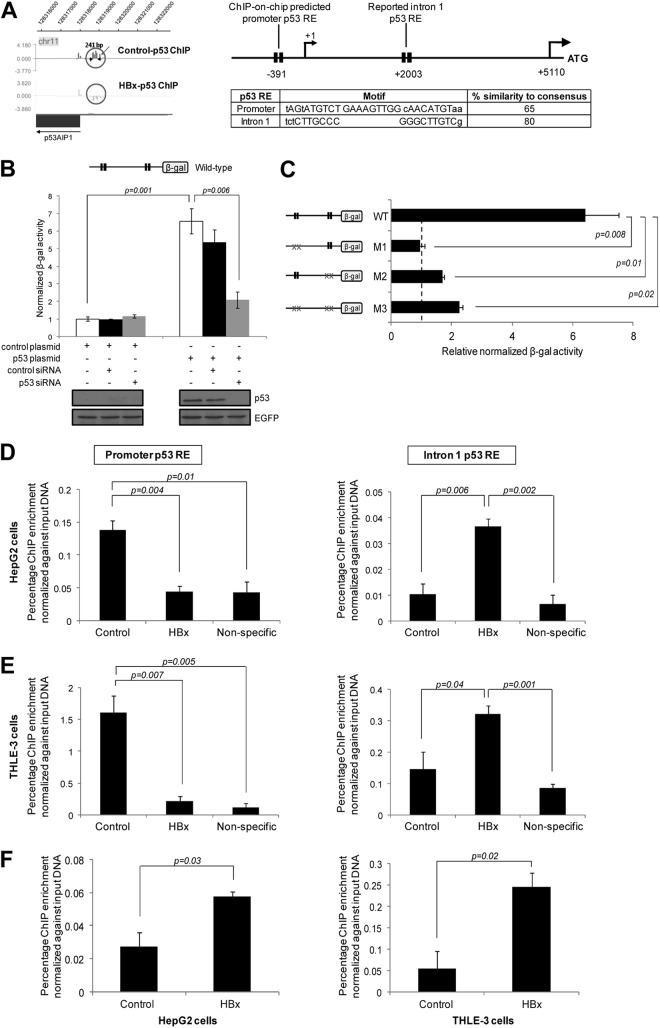
HBx shifts p53 binding at the p53AIP1 regulatory region. (A) (Left) Illustration of the ChIP-on-chip-identified p53 binding region at the p53AIP1 promoter, generated using SignalMap software (NimbleGen Systems). Decreased p53 occupancy at the novel p53AIP1 promoter RE by HBx is indicated by the absence of a peak in the HBx-p53 ChIP sample. (Right) Schematic of p53 RE positions relative to the p53AIP1 gene. Each p53 RE is depicted as two black boxes, each representing one half-site of the p53 consensus sequence. Nucleotides in capital letters represent identity of the genomic sequence to the consensus; nucleotides in lowercase letters represent disparity with the consensus. The transcription start site (+1) and translation start site (ATG) of the p53AIP1 gene are shown. p53 motifs and percent similarity to the consensus sequence of promoter and intron 1 REs are shown. (B) p53 stimulates p53AIP1 promoter activity. p53-deficient Hep3B cells were cotransfected with the wild-type promoter construct and the indicated plasmids and/or siRNA and assayed for β-Gal activity. (C) Both promoter and intron 1 p53 REs are functional and necessary for p53AIP1 regulation. Hep3B cells were cotransfected with the indicated wild-type or mutant promoter constructs and p53 or control plasmid. Basal β-Gal activity is denoted by the vertical black dashed line. Mutant p53 REs are indicated by xx. (D and E) p53 ChIP-qPCR validation of decreased p53 occupancy at the promoter RE (left) and increased p53 occupancy at the intron 1 RE (right) in HBx and control HepG2 (D) and THLE-3 (E) cells. Nonspecific ChIP control was performed using normal IgG. (F) ChIP-qPCR using HBx-specific antibody performed on HBx and control HepG2 (left) and THLE-3 (right) cells. All error bars show standard errors of the mean from triplicate experiments.

