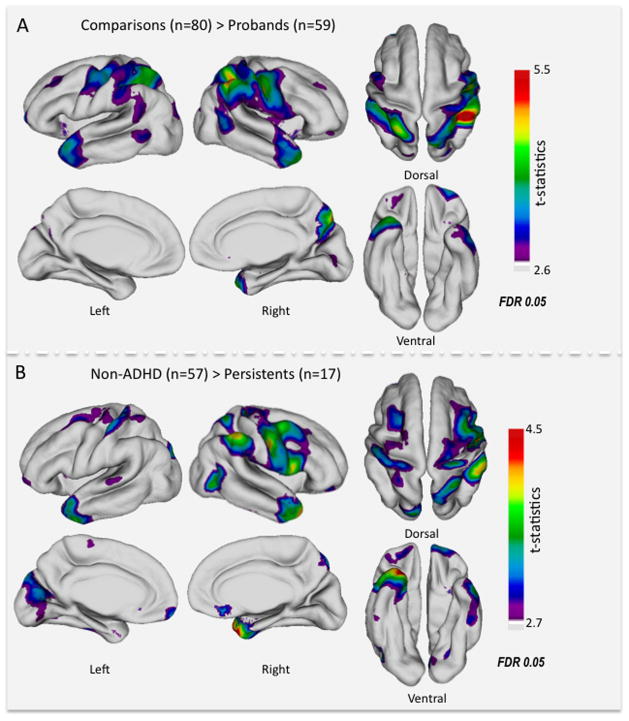
Figure 1.
(A) t-map of the significant cortical thinning in probands with ADHD (n=59) compared to comparisons (n=80). (B) t-map of the significant cortical thinning in probands with persistent ADHD (n=17) compared to non-ADHD comparisons (n=57). False Discovery Rate (FDR) threshold depends on the data and is different for the right and left hemispheres. Here the t-statistics at the lowest FDR threshold are projected across each hemisphere for each comparison.

