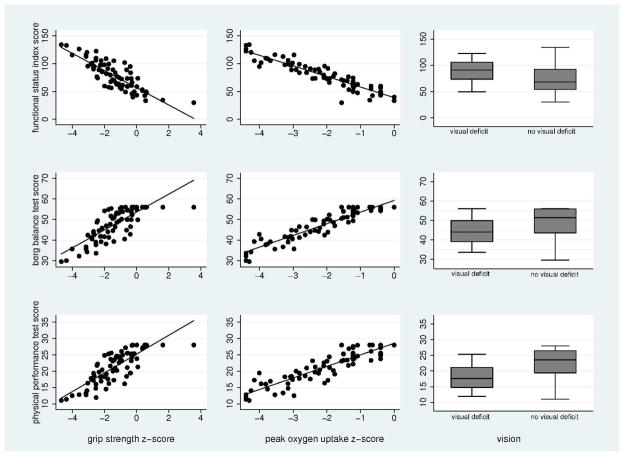
Figure 3. The association between grip strength, peak oxygen uptake and visual deficits and scores on physical performance scales from a linear regression model.
Higher scores on the FSI represent worse performance. Lower scores on the Berg and PPT represent worse performance. Grip strength and peak oxygen uptake z-scores were calculated based on published age and gender matched reference values from “healthy populations.”19, 21

