Figure 3.
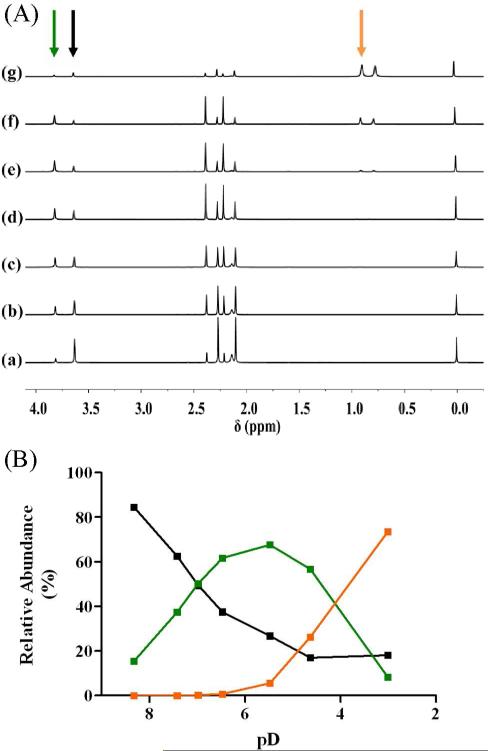
DCl titration of 2. (A) 1H NMR spectra of 2 with successive additions of DCl; the alkyl region is highlighted showing the presence of three distinct [Co(acacen)(X1X2)]+ species at acidic conditions (arrows). (a) pD 8.32, (b) pD 7.42 , (c) pD 6.98, (d) pD 6.47, (e) pD 5.48 , (f) pD 4.63, and (g) pD 3.01. (B) Relative abundance of each [Co(acacen)(X1X2)]+ derivative in solution as a function of pD;  = 2,
= 2,  = [Co(acacen)(NH3)(D2O)]+,
  = [Co(acacen)(D2O)2]+.

