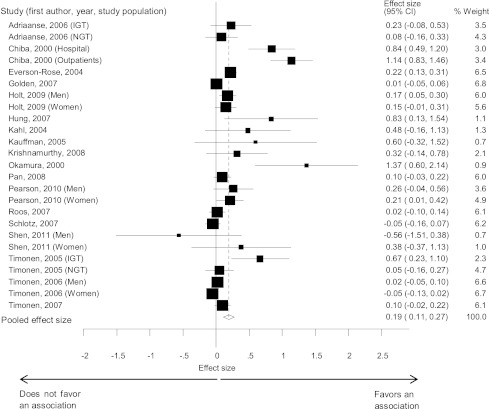
Figure 2.
Forest plots showing the effect size of the association between depression and insulin resistance. Estimates are at the center of the boxes and drawn in proportion to the SEs. Lines indicate 95% CIs. Diamond shows the pooled effect size at its center and 95% CI at its horizontal points. IGT, impaired glucose tolerance; NGT, normal glucose tolerance.

