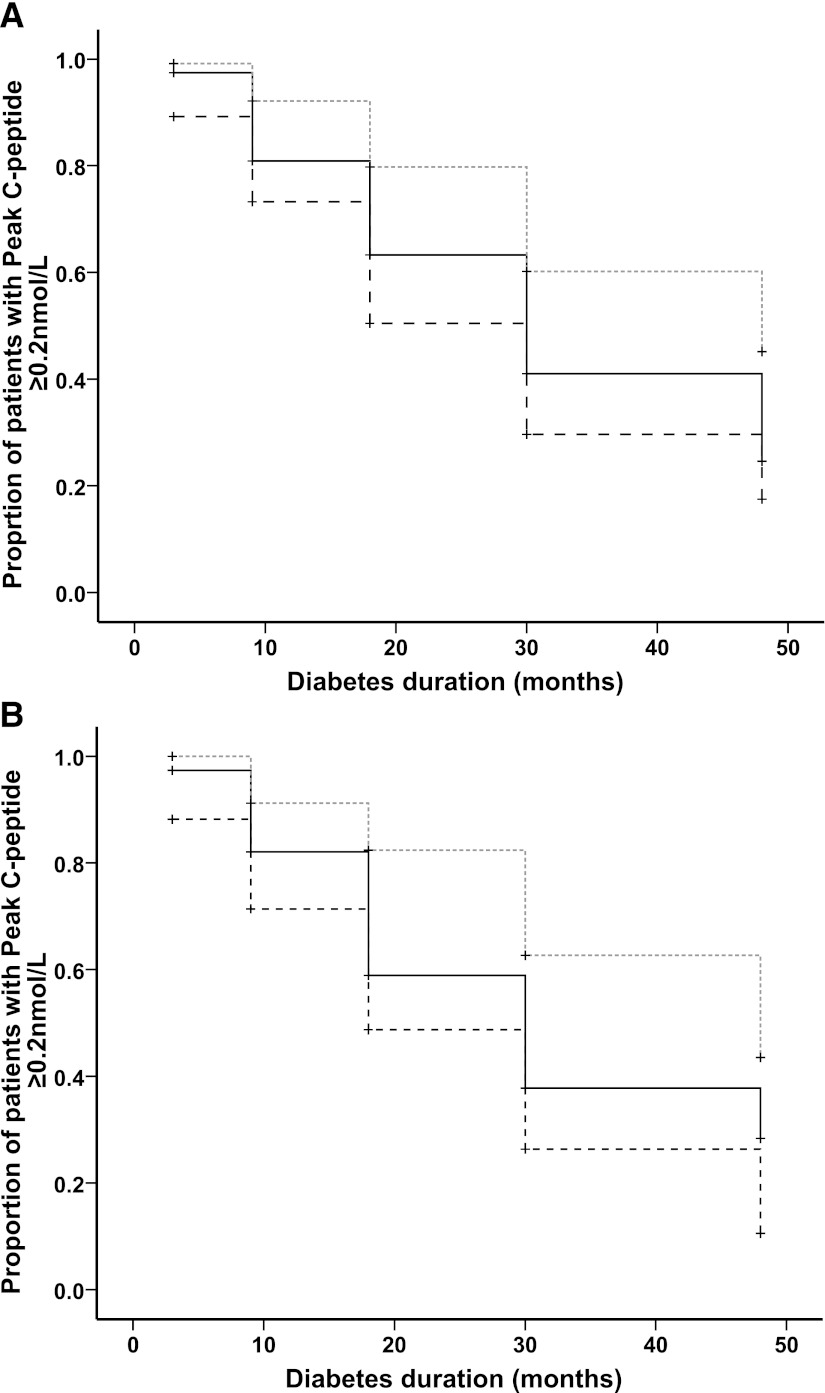
Figure 3.
Kaplan-Meier survival plots to show the impact of FCP (A) and age at diagnosis (B) on the time taken for patients to become insulin deficient (peak CP <0.2 nmol/L). A: FCP is divided by tertiles, in which dashed black line refers to FCP <0.17 nmol/L, solid black line refers to FCP 0.17–0.29 nmol/L, and dashed gray line refers to FCP ≥0.29 nmol/L. Current duration is used in the cases of censored data (+) in which last recorded peak CP is >0.2 nmol/L). B: Age of diagnosis is divided by tertiles, in which dashed black line refers to age <10 years, solid black line refers to age 10–13 years, and dashed gray line refers to age ≥13 years. Current duration is used in the cases of censored data (+) in which last recorded peak CP is >0.2 nmol/L).

