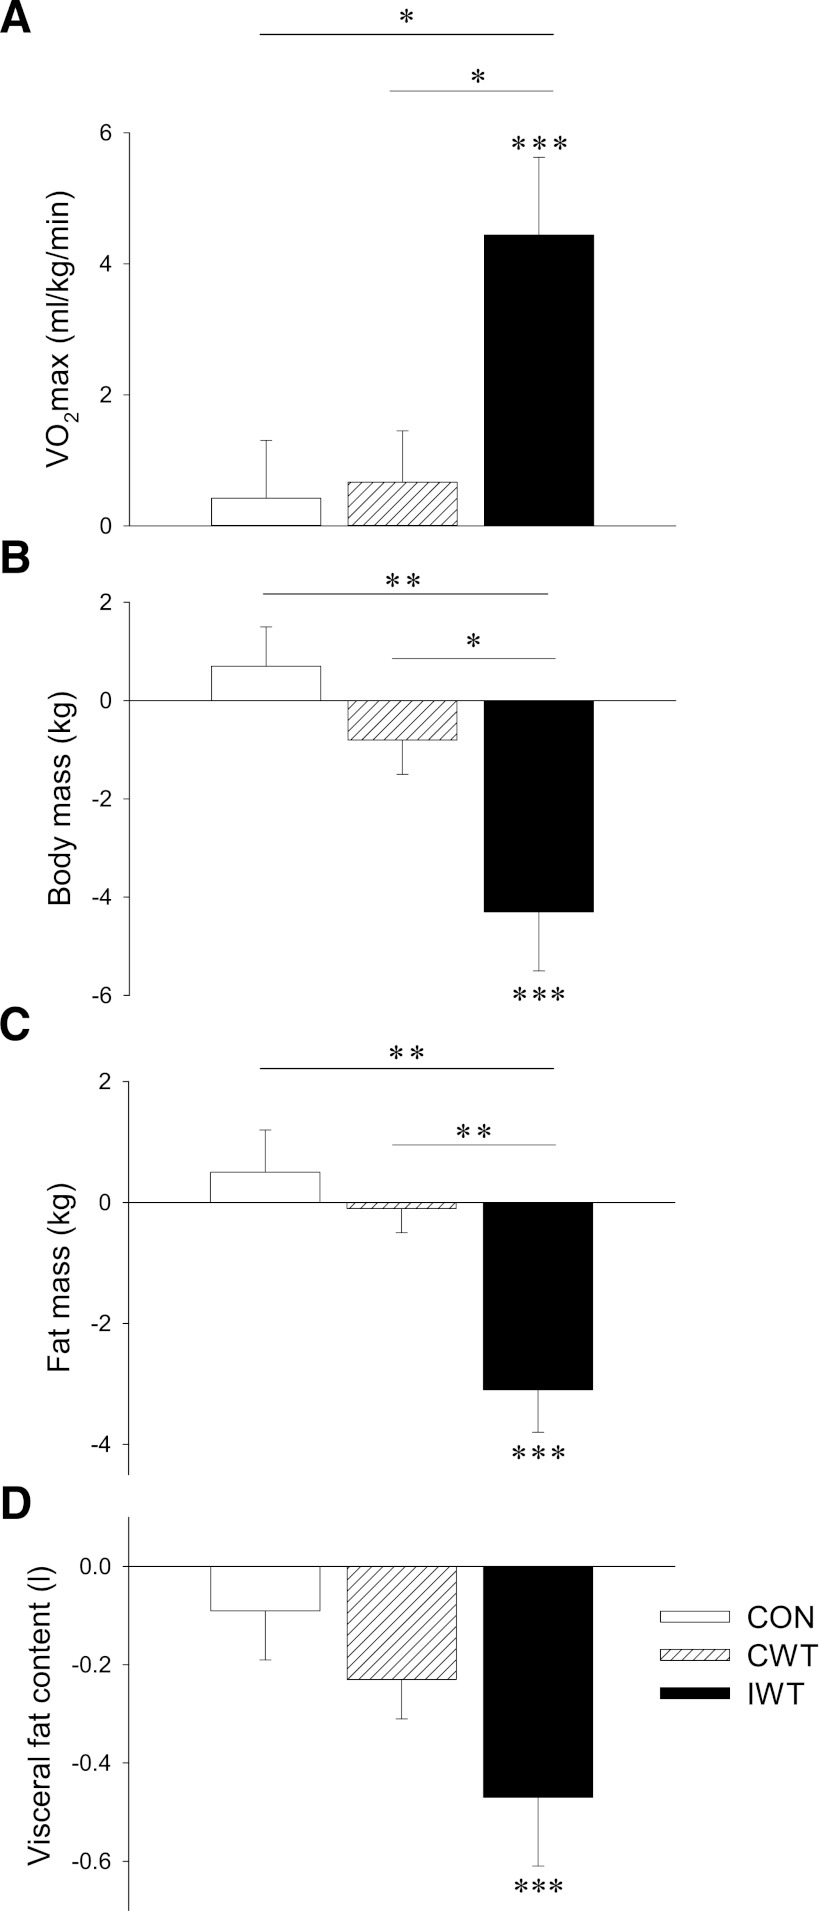
Figure 1.
Subjects with type 2 diabetes were randomized to a CON (white bars), CWT (striated bars), or IWT group (black bars). Aerobic fitness (VO2max) (A), body mass (B), whole-body fat mass (dual-energy X-ray absorptiometry) (C), and abdominal visceral adiposity (MRI) (D) were measured at baseline and after 4 months. Data are presented as mean Δ values (post − preintervention values) ± SEM. Statistical differences were analyzed by two-way repeated-measures ANOVA when comparing pre to post changes within groups (indicated by ***P < 0.001), and one-way ANOVA of Δ values when comparing differences between groups (indicated by a connecting line between bars; *P < 0.05 and **P < 0.01).

