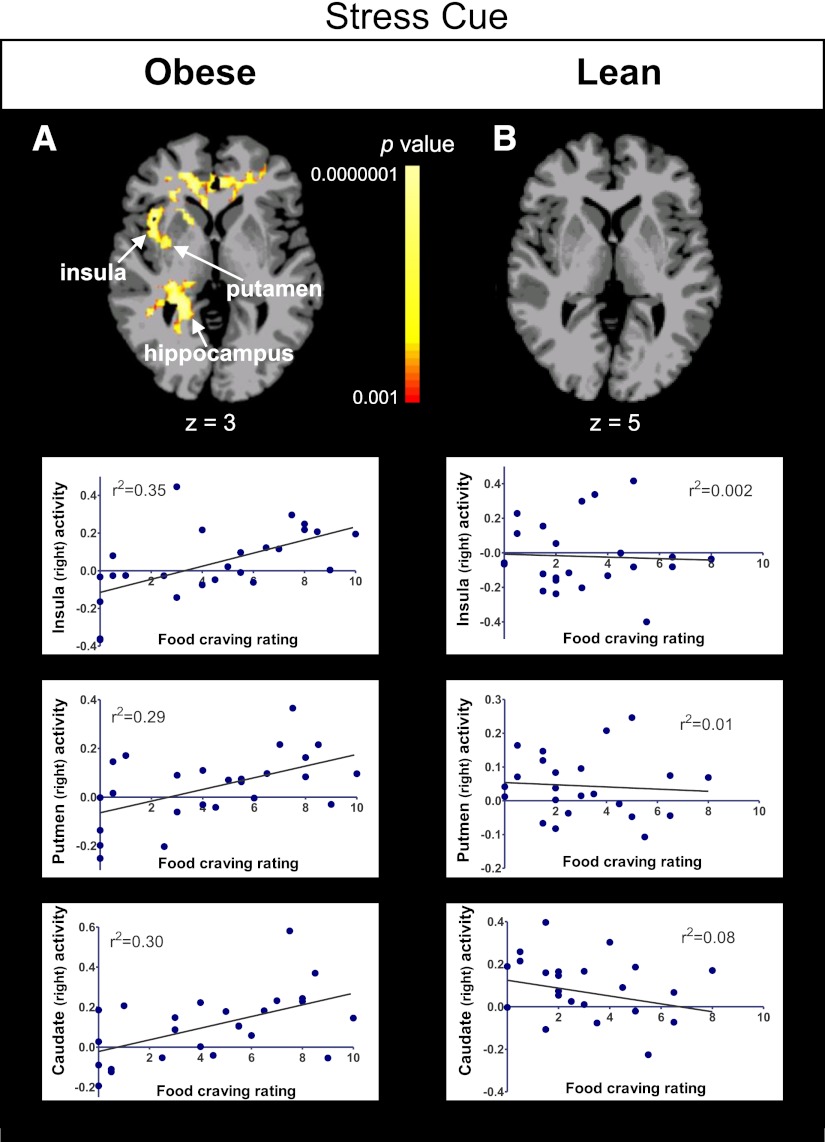
Figure 3.
Whole-brain, voxel-based correlation analyses with food craving. Axial brain slices showing correlations between food-craving ratings and neural activation in the stress condition in the obese (A) and lean (B) groups (thresholded at P < 0.05, FWE corrected). Representative scatterplots are presented from key relevant brain regions within each group. The color scale provides P values. Talairach coordinate z levels are indicated. β Weight values are depicted on the y-axis. (A high-quality color representation of this figure is available in the online issue.)

