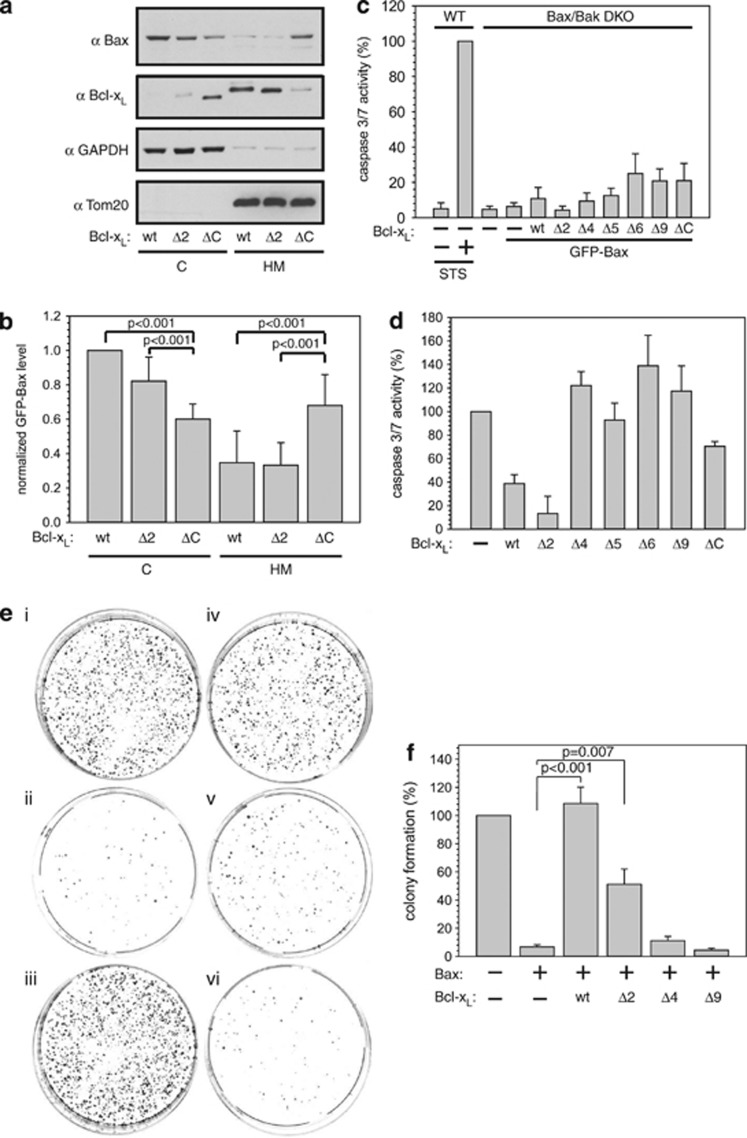
Figure 4.
Bax accumulates on mitochondria at low retrotranslocation rates. (a) Western blot analysis of Bax localization in the presence of different Bcl-xL variants. Cytosol (C) and heavy membrane fraction (HM) of HCT116 cells expressing green fluorescent protein (GFP)-Bax and different variants of Bcl-xL. Glyceraldehyde 3-phosphate dehydrogenase (GAPDH) and Tom20 serve as fractionation controls. (b) Quantification of GFP-Bax levels in the C and in the HM is dependent on the presence of different Bcl-xL variants revealed by western blot. P-values according to a one-way analysis of variance (ANOVA) test are depicted (n=4). (c) Apoptosis signaling based on caspase-3/7 activity measured in HCT116 Bax/Bak DKO cells overexpressing GFP-Bax and either wt Bcl-xL or C-terminal deletion variants of Bcl-xL. Measured caspase activities are displayed as normalized to untransfected cells and relative to the activity detected in HCT116 wt cells after apoptosis induction by staurosporine (STS, 1 μM) for 18 h. Untreated HCT116 cells and mock-transfected HCT116 Bax/Bak DKO cells served as controls. Data represent averages±S.E.M. (n≥3 × 3) wells. (d) STS (1 μM)-induced apoptosis activity of GFP-Bax in the presence of different Bcl-xL variants based on caspase-3/7 activity measured in HCT116 Bax/Bak DKO cells relative to the activity obtained in the absence of Bcl-xL overexpression and normalized to mock-transfected cells. Data represent averages±S.E.M. (n≥3 × 3 wells). (e) HCT116 Bax/Bak DKO cells were transfected with pcDNA (i), GFP-Bax+pcDNA (ii), GFP-Bax+wt Bcl-xL (iii), GFP-Bax+Bcl-xL Δ2 (iv), GFP-Bax+Bcl-xL Δ4 (v) and GFP-Bax+Bcl-xL Δ9 (vi), 1 μM STS was added for 24 h, cells were replated and colonies were stained with methylene blue 14 days after treatment. (f) Quantification of colony formation depicted in (e) relative to colony formation of pcDNA-transfected HCT116 Bax/Bak cells. Data are presented±S.E.M. (n=8). P-values according to Student's t-test are shown

