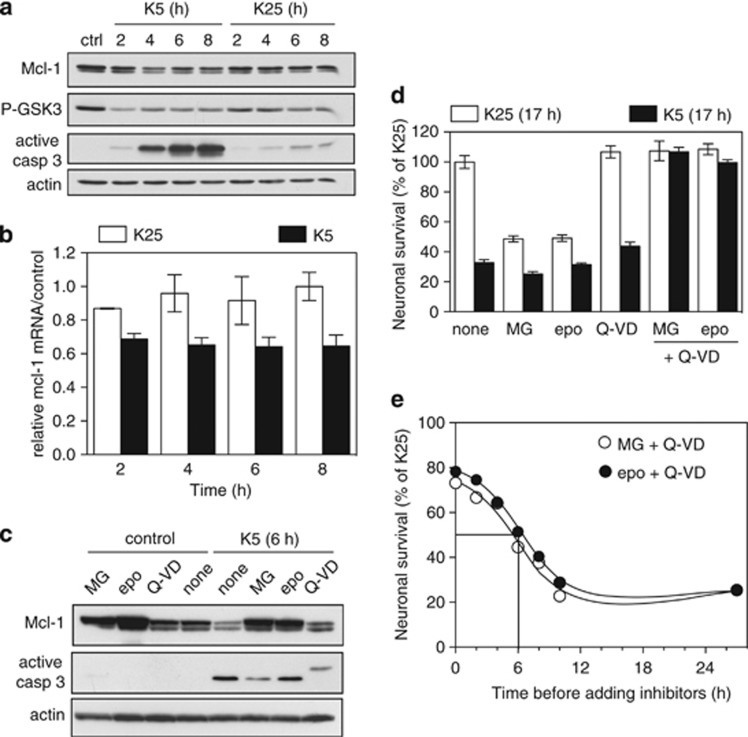
Figure 1.
Mcl-1 is degraded by the proteasome during KCl deprivation-induced apoptosis in CGNs. (a) CGN primary cultures were left untreated (ctrl) or washed and switched to serum free medium containing either 25 mM KCl (K25) or 5 mM KCl (K5) for increasing times. Total protein extracts were prepared and western blot analysis was performed with antibodies against Mcl-1, the phosphorylated form (Ser9) of GSK3, the active (cleaved) form of caspase 3 and actin (loading control). (b) CGNs were incubated in K25 or in K5 medium for the indicated times. Total RNA was extracted and mcl-1 mRNA levels were estimated by quantitative RT-PCR. Fold change was calculated by comparison with neurons maintained in the initial culture medium (ctrl). Data are means±S.D. of triplicates and are representative of five independent experiments. (c) CGNs were left untreated (control) or switched to K5 medium in the presence or absence of 20 μM MG-132 (MG), 10 μM epoxomicin (epo) or 100 μM Q-VD-OPh (Q-VD) for 6 h. Total protein extracts were analyzed by western blot using antibodies against Mcl-1, active caspase 3 and actin. (d) CGN primary cultures were switched to K25 or K5 medium in the presence or absence of 5 μM MG-132, 5 μM epoxomicin, 50 μM Q-VD-OPh or a combination of proteasome and caspase inhibitors for 17 h. Then, neuronal viability was determined by MTT assay. Data are the means±S.D. of triplicate determinations obtained in a typical experiment representative of five independent experiments. Results are expressed as the percentage of surviving neurons compared to neurons maintained in K25 medium. (e) To determine the proteasomal commitment point, CGNs were switched to K5 medium at time 0 to induce apoptosis. At increasing times after deprivation, proteasome inhibitors were added to the medium together with a caspase inhibitor: 5 μM MG-132+50 μM Q-VD-OPh (open circle) or 5 μM epoxomicin+50 μM Q-VD-OPh (closed circle), in order to rescue neurons. Neuronal viability for all conditions was estimated 27 h after KCl deprivation by MTT assay. Results are expressed as percentage of surviving neurons compared with cultures maintained in K25 throughout the experiment. Data are the means of two independent experiments performed with different neuronal cultures

