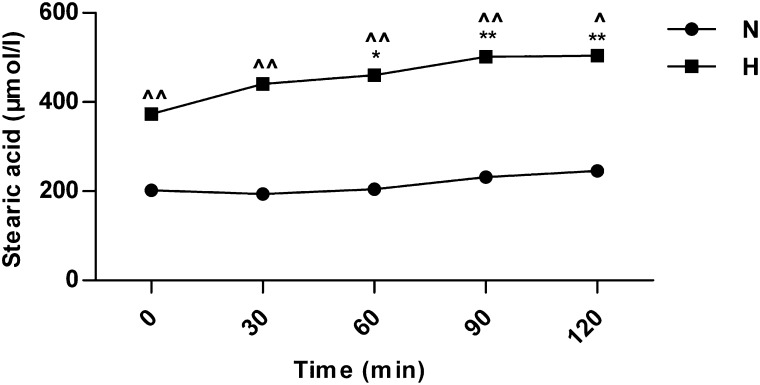
FIG. 3.
The changes in serum SA after glucose loading in normal and hyperlipidemic mice. n = 6 for each time point in each group. *P < 0.05, **P < 0.01 compared with the value at 0 min after glucose loading in the same group; ^P < 0.05, ^^P < 0.01 compared with the value of normal mice at the same time point. H, hyperlipidemic mice; N, normal mice.

