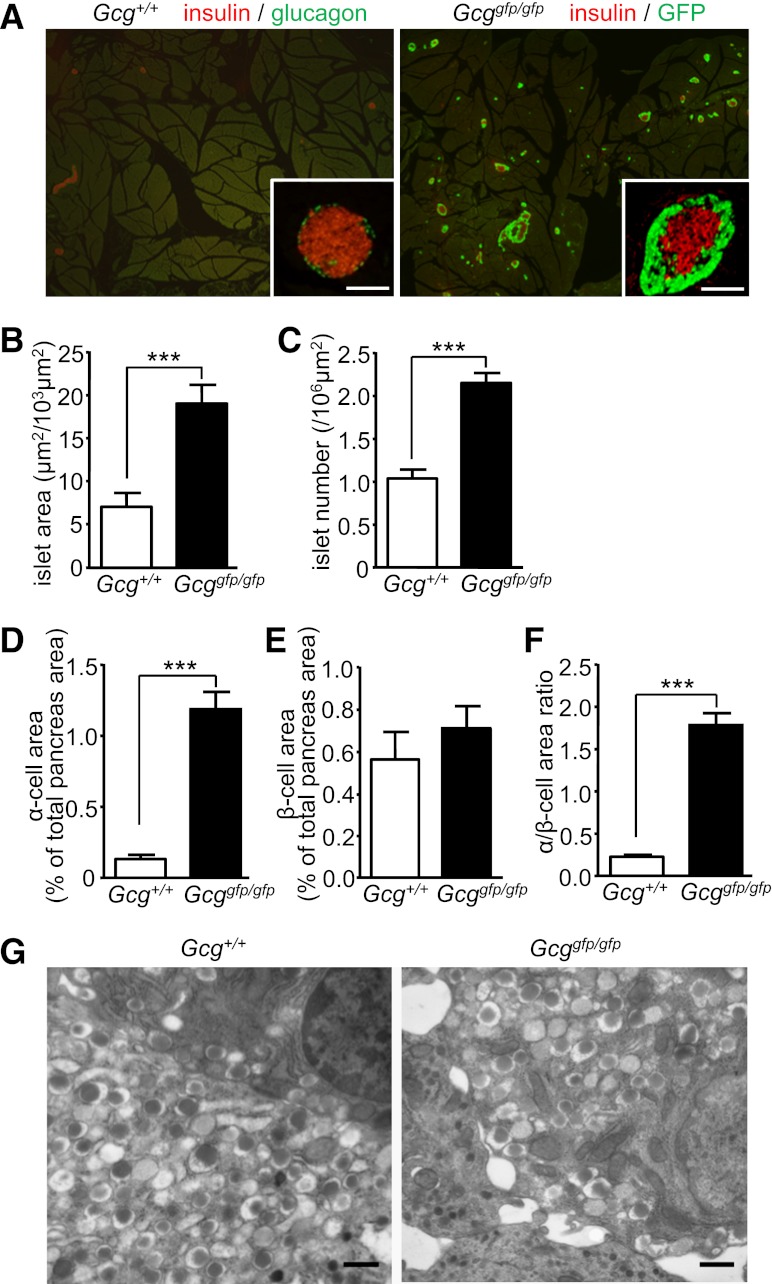
FIG. 2.
Gcggfp/gfp mice exhibit α-cell hyperplasia. A: Representative pancreatic sections from 9-week-old Gcg+/+ (left) and Gcggfp/gfp (right) mice. In the left panel, sections were immunostained for glucagon (green) and insulin (red). In the right panel, sections were immunostained for insulin (red) and shown with autofluorescence of GFP. Scale bar, 100 µm. B–F: Morphometric analysis of islets. B: Islet area shown relative to a 103-µm2 sectional area. C: Islet number shown relative to a 106-µm2 sectional area. D: The α-cell area shown as glucagon-positive or GFP-positive area relative to total pancreas area. E: The β-cell area shown as insulin-positive area relative to total pancreas area. F: The α-cell/β-cell area ratio shown as a ratio of glucagon-positive or GFP-positive area relative to insulin-positive area. G: Electron microscopy of islets. Scale bar, 500 nm. Values are expressed as means ± SEM. ***P < 0.001. (A high-quality digital representation of this figure is available in the online issue.)

