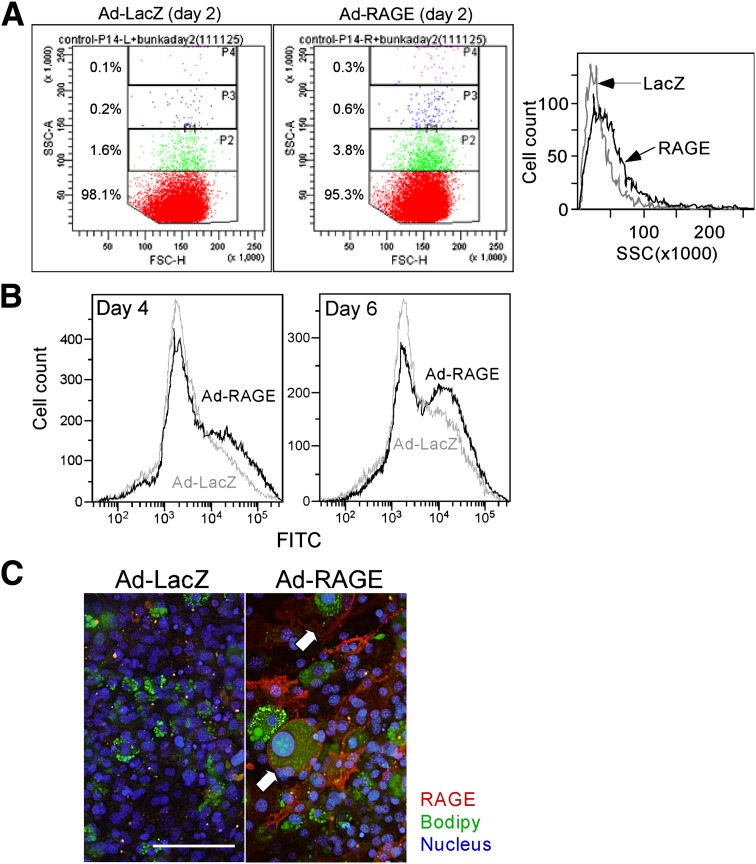
FIG. 2.
Flow cytometric analysis for adipogenesis. Adipogenic differentiation of 3T3-L1 cells was analyzed by flow cytometry (FACS Canto; BD Biosciences) as described previously (19). Cells were briefly rinsed twice with prewarmed 0.25% trypsin-EDTA and then incubated for 5 min at 37°C. Cells were then gently resuspended in PBS, washed twice with PBS, resuspended in cold PBS, and kept on ice prior to flow cytometric analysis. A: Following differentiation process, the Ad-RAGE–infected cells with greater SSC were increased as early as day 2 as compared with Ad-LacZ–infected cells. Distribution of SSC intensity at day 6 is shown in the right panel. B: At days 4 and 6 of differentiation, Ad-LacZ– or Ad-RAGE–infected 3T3-L1 cells were stained for 1 h with 0.5 μmol/L BODIPY to analyze the proportion of lipid-laden cells prior to flow cytometry. Fluorescein isothiocyanate (FITC) intensity was analyzed to determine lipid-rich differentiated adipocytes. C: Double-immunofluorescent analyses for RAGE expression and lipid accumulation. 3T3-L1 preadipocytes were infected with Ad-RAGE or LacZ and then cultured with differentiation media. Expression of human RAGE in the differentiated 3T3-L1 adipocytes was analyzed at day 6, and the cells were costained with 0.5 μmol BODIPY to visualize adipocytes and with DAPI to visualize the nuclei. Scale bar, 100 μm. (A high-quality digital representation of this figure is available in the online issue.)

