
FIG. 2.
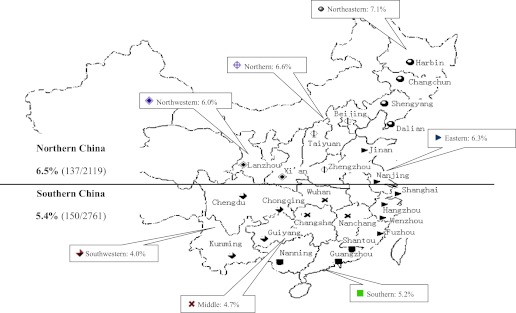
China map for LADA China Study.  , cities from the northeastern part of China;
  , cities from the northern part of China;
  , cities from northwestern China;
  , cities from eastern China;
  , cities from central China;
  , cities from southern China; and
  , cities from southwestern China. LADA frequency was higher in northern than southern China after age, sex, and BMI adjustment (P < 0.040). (A high-quality color representation of this figure is available in the online issue.)