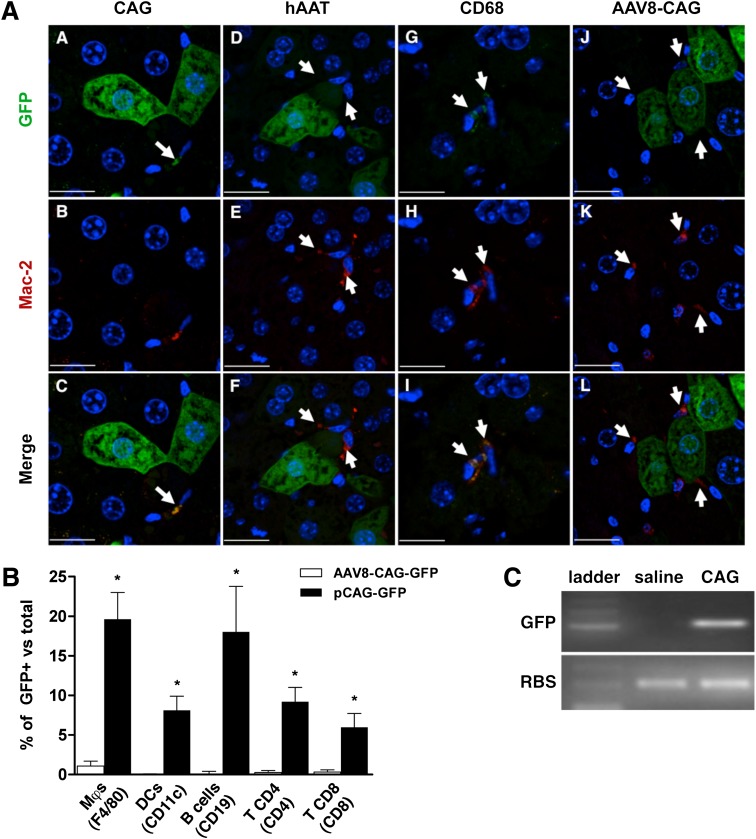
FIG. 1.
Gene transfer to liver NPCs after HTV injection of plasmid DNA. A: Analysis of GFP and macrophage marker Mac-2 expression in hepatic cells. GFP and Mac-2 expression were examined 24 h after HTV injection of CAG-GFP (A–C), hAAT-GFP (D–F), and CD68-GFP (G–I) plasmids and 1 month after injection of an adeno-associated vector serotype 8 expressing GFP (AAV8-CAG-GFP) (J–L). White arrows indicate the localization of KCs. Scale bars: 18 µm (A–C); 22 µm (D–F); 16 µm (G–I); 24 µm (J–L). B: Flow cytometric analysis of GFP expression in liver NPCs 24 h after HTV injection of pCAG-GFP. Cell markers used to define populations are indicated in parentheses. Results are mean ± SEM of GFP+ cells within each population, n = 4 mice per group. *P < 0.05 vs. AAV8-CAG-GFP. C: Expression of GFP in NPCs. A single GFP-specific band was amplified in FACS-sorted CD11b+ cells from pCAG-GFP–treated livers. RBS, ribosomal protein S26. Data in B are representative of four independent experiments. The immunohistochemistry images are representative examples of three different mice per group. (A high-quality digital representation of this figure is available in the online issue.)

