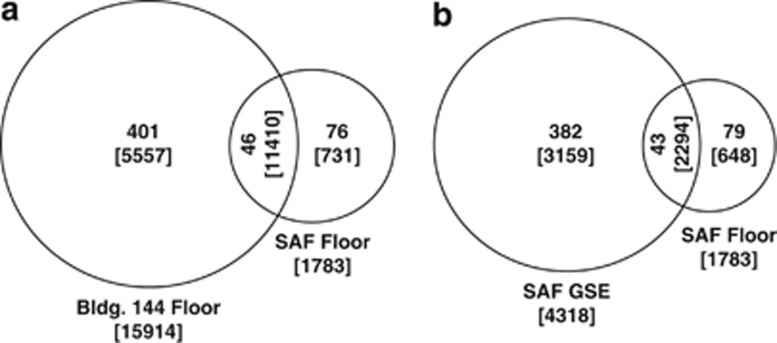
Figure 1.
Venn diagram showing the MOTU detected in various samples of the cleanrooms. Comparison (a) between SAF and Bldg 144 cleanroom floor samples and (b) between floor and GSE samples of SAF cleanroom. Parentheses denote total number of pyrosequences generated and the numerals without parentheses are total number of MOTU present in that sample.

