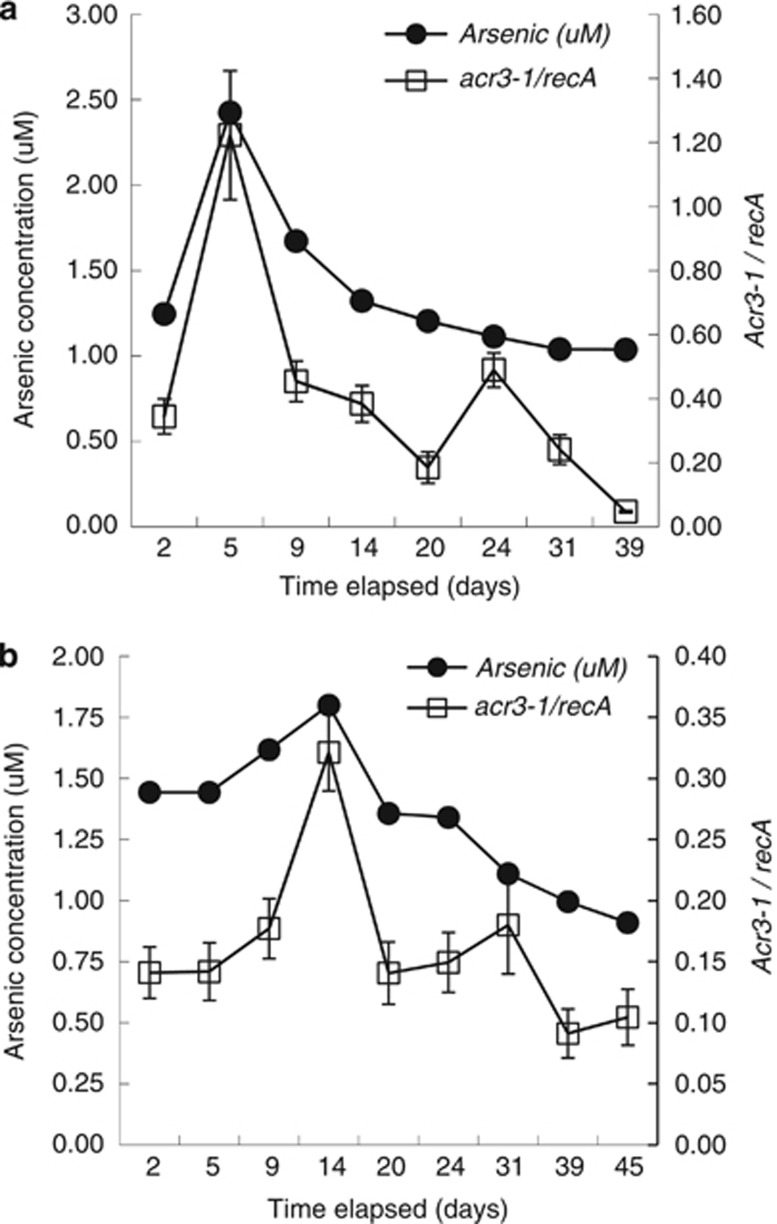
Figure 7.
Arsenic concentrations and transcripts levels of acr3-1 normalized to recA in well CD01 (a) and CD04 (b) over the course of the biostimulation experiment at Rifle, CO, USA. Error bars represent propagation of errors of triplicate real-time PCR reactions. Open squares, acr3-1 genes; closed circles, arsenic.

