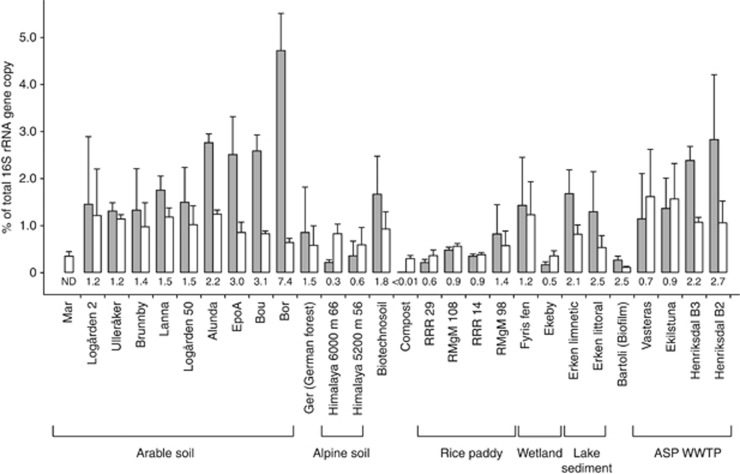
Figure 3.
Relative abundance of clade I (open bars) and clade II (gray bars) nosZ gene copies in samples from different environmental types, calculated as proportion of total bacterial 16S rRNA gene copies (mean±s.d.; see Supplementary Table S2 for number of replicates per site). The ratio of clade II to clade I mean relative abundance is shown for each sample below the bars. ASP/WWTP denotes samples from activated sludge processes in municipal wastewater treatment plants with nitrogen removal processes.

