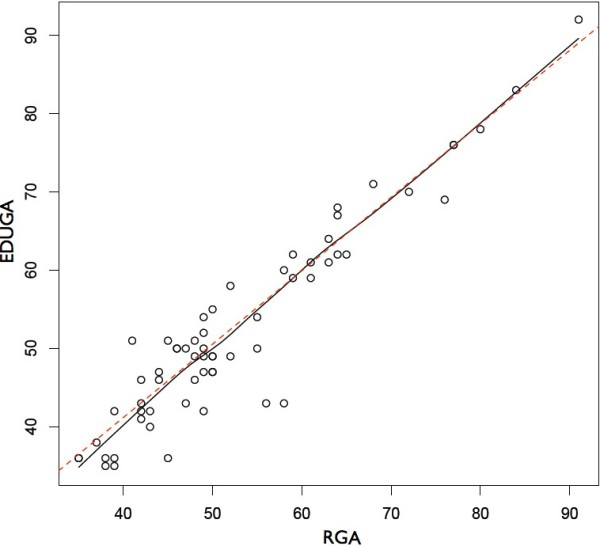
Figure 5.

Scatter plot comparing EDUGA and RGA. The x and y-axes measure gestational age in days. Data represented exclude cases in which a fetal pole was not clearly identified. The solid line represents the actual fit; the dashed line is the ideal fit.
