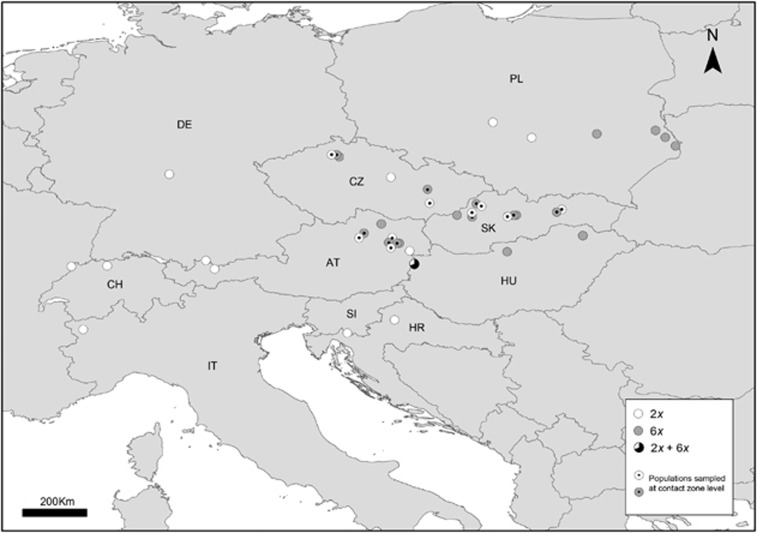
Figure 1.
Location of the populations of Aster amellus studied. Cytotypes are represented by different colors: white circles-diploid (2x); grey circles-hexaploid (6x). The mixed population is represented by a pie diagram representing cytotype proportions (white-2x; black-6x). All locations were used in the large-scale spatial analyses; locations with dots represent the populations used in the intermediate spatial scale (contact zone). The population from Turkey (2x) is not displayed on the map. Country codes: AT, Austria; CH, Switzerland; CZ, Czech Republic; DE, Germany; HR, Croatia; HU, Hungary; IT, Italy; PL, Poland; SI, Slovenia; SK, Slovakia.

