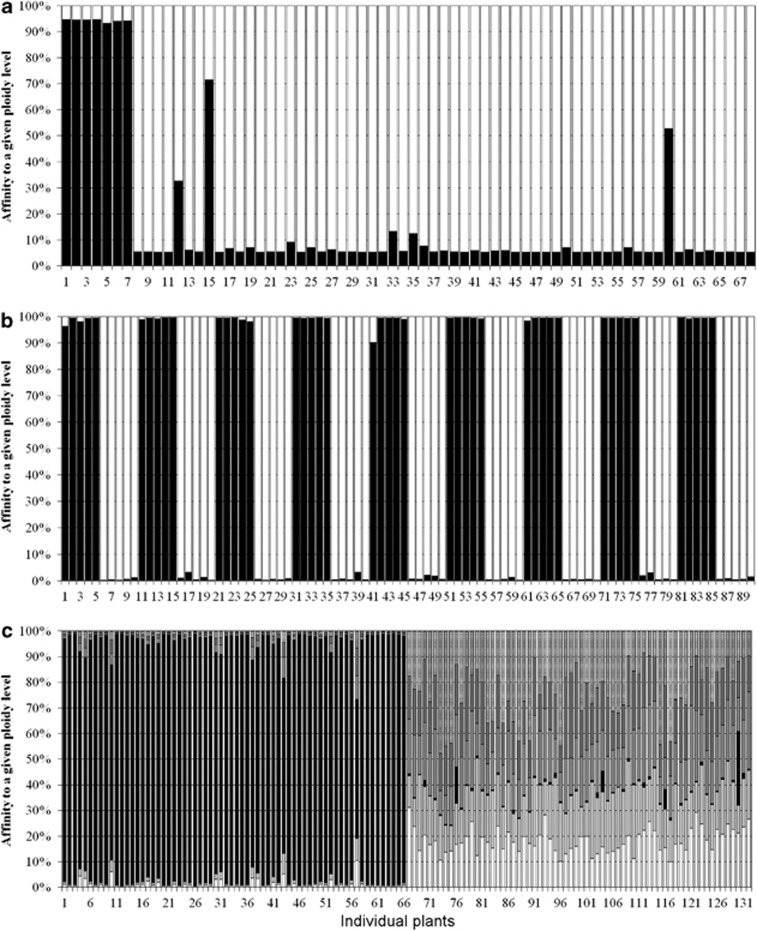
Figure 3.
Individual assignment based on Bayesian genotypic cluster analysis performed using STRUCTURE. Histograms demonstrate the proportion of each individual's genome that can be assigned to each of the clusters. (a) Mixed-ploidy population (individuals 1–7 are diploid, the remaining are hexaploid) at K=2. (b) Contact zone between cytotypes at K=2 (individuals are sorted by pairs of populations, the diploid population within each pair goes first; that is individuals 1–5 are diploids of pair 1, individuals 6–10 are hexaploids of pair 1, individuals 11–15 are diploids of pair 2). (c) Large spatial scale across Europe at K=6 (Individuals 1–66 are diploid, 67–132 are hexaploid).

