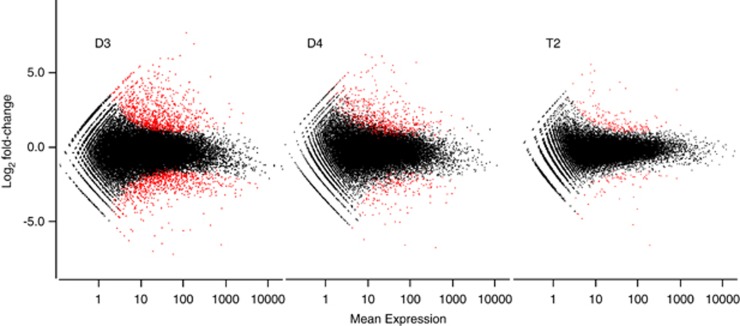
Figure 3.
T2 allotetraploids exhibit a smaller transcriptional response to EL than their diploid progenitors. Scatter plots of fold change (log scale) in expression (EL/LL) vs mean expression (average of expression under excess and limting light), as estimated by DESeq. Significant differences (FDR⩽0.05; Benjamini–Hochberg adjustment) are indicated in red, non-significant differences (FDR>0.05) in black. The smaller transcriptional response to EL in T2 is apparent in both the smaller degree of scatter and fewer significantly differentially expressed genes.

