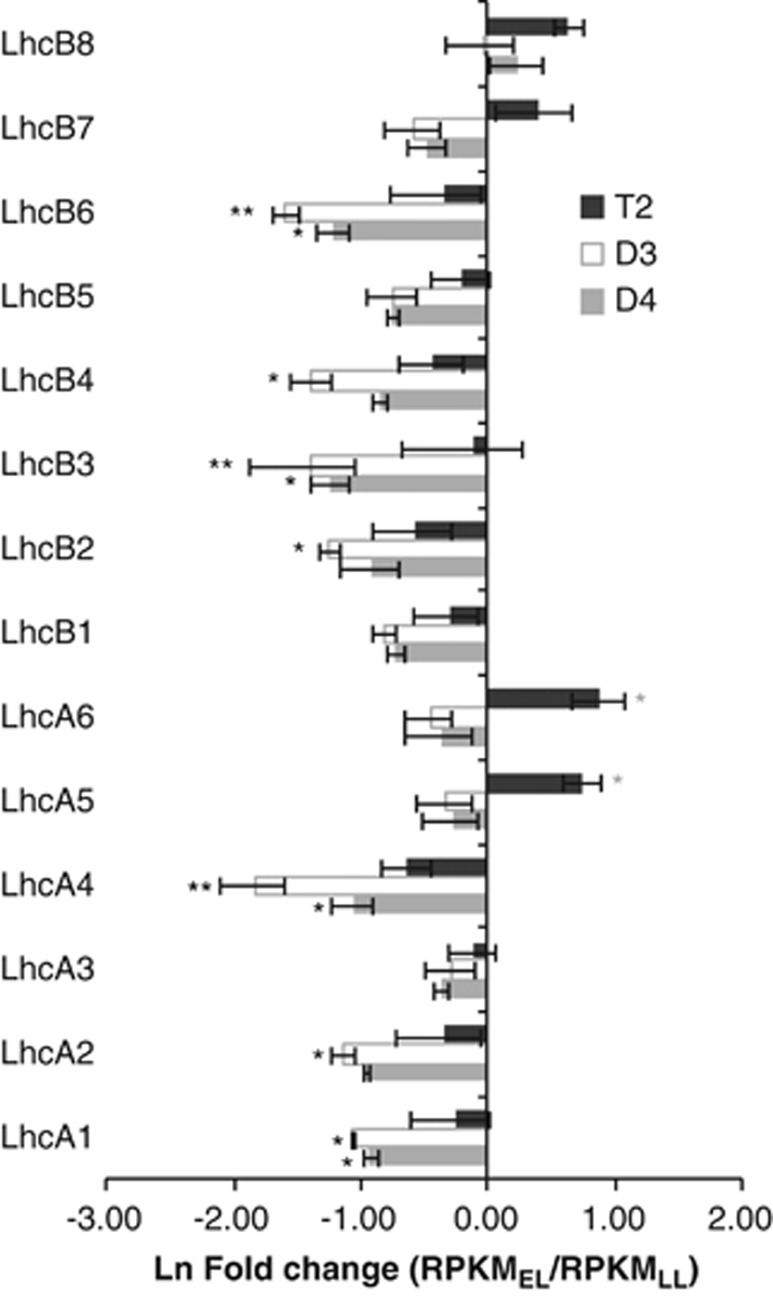
Figure 4.
T2 allotetraploids exhibit less downregulation of LHC gene families than their diploid progenitors in response to EL. Fold change in combined gene family expression (the sum of expression from all gene family members) from limiting to EL for each of the 12 LHC gene families (LhcA1-6 and LhcB1-6). Error bars represent s.e. (N=3). Expression data were derived from RNA-Seq transcript profiles. Single asterisks indicate differences in expression between EL and LL with an unadjusted p-value <0.05. Double asterisks indicate differences in expression with FDR<0.05 (Benjamini–Hochberg adjustment). Significance levels were determined using DESeq.

