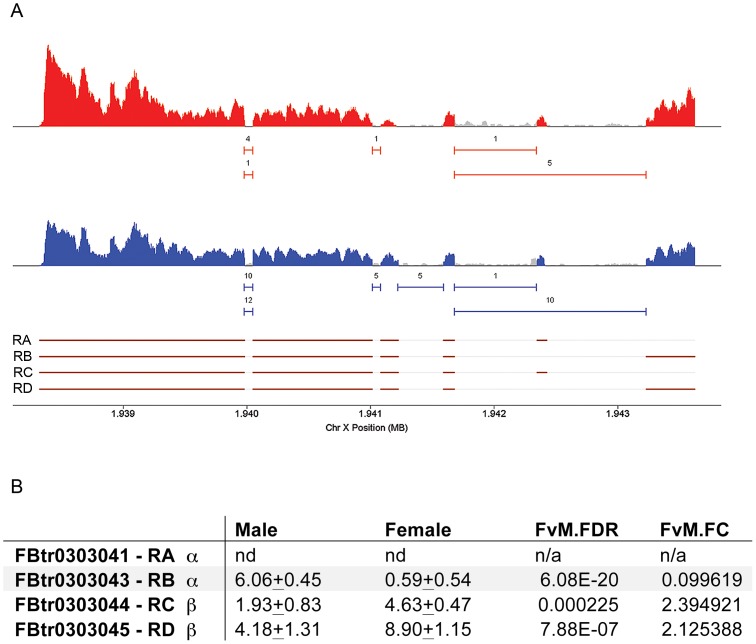
Figure 4. moody transcript isoforms are expressed differently in males and females.
a) Coverage plots, junction plots and gene models [44] for moody are shown. Coverage plots for exon sequences are shown with peaks in red (females) and blue (males) indicating coverage from RNA from females and males, respectively; grey indicates non-exonic gene regions as annotated by Flybase. Junction plots are shown as solid horizontal lines beneath the coverage plots. The number above each line indicates the number of sequence reads that span a junction. All numbers are based on 1 million mapped reads. Flybase gene models are shown at the bottom of the panel with exon regions shown in brown. b) Of the four previously identified isoforms (http://flybase.org/reports/FBgn0025631.html), one (FBtr0303041-moody RA) was not detected in adult heads. FBtr0303043 (moody-RB) which encodes an alpha isoform is significantly enriched in males in comparison to females, whereas FBtr0303044 (moody-RC) and FBtr0303045 (moody RD) which encode beta isoforms are enriched in females in comparison to males. F: Female; M: Male; FDR: False discovery rate; FC: Fold change.

