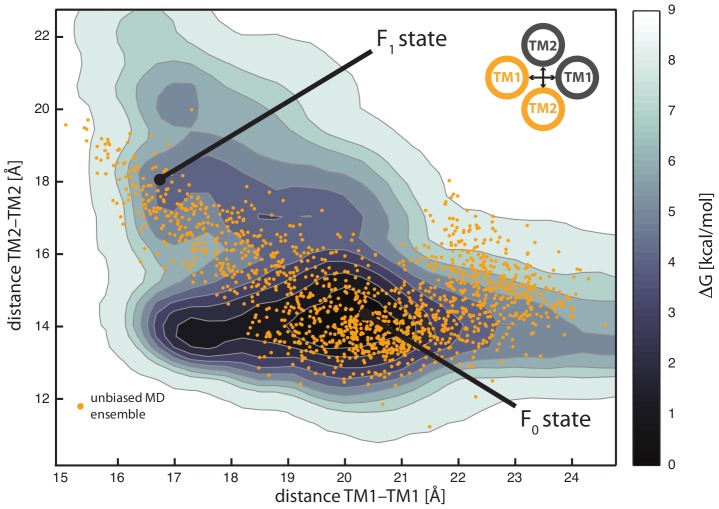
Figure 6. Free energy landscape for the TM conformational change.
The free energy landscape defined by sampling inter-helical distances between TM1 C-termini and TM2 N-termini is reported. The conformational change observed in the unbiased MD simulations (orange points) occurs along a free energy valley, that connects a main equilibrium state (F0) and a high-energy conformation, and can be associated with relevant states during the signaling process (F1, ∼5 kcal/mol higher in free energy).

