Figure 7.

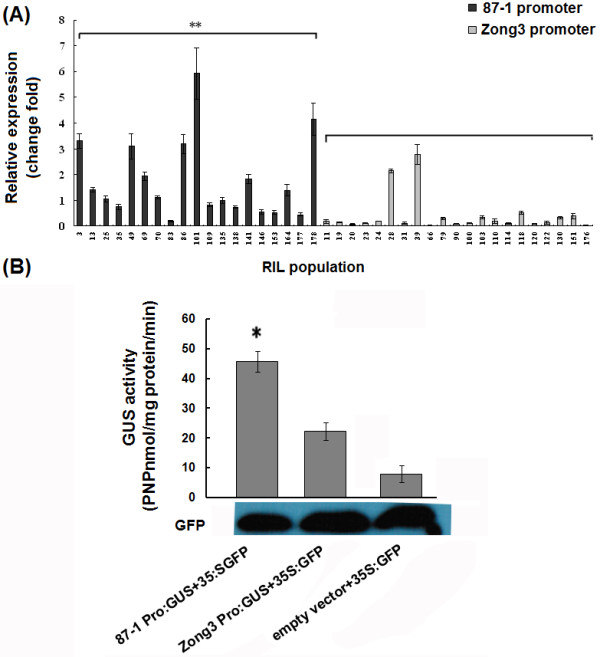
Analysis of pri-miR164b promoter activity.A. Expression analysis of Zm-miR164b in the RIL population. The darker columns were the RIL lines that contained the same promoter with 87-1, while the lighter ones had the same promoter with Zong3. ** represented significant difference between RIL plants containing the promoter from 87-1 and RIL plants containing the Zong3 promoter. B. GUS activity (nmole PNP/mg protein/min) as analysis driven by different promoters. GUS activity that was driven by the Zm-miR164b promoter from 87-1 and Zong3 in the tobacco leaf tissues was expressed as p-nitrophenol (PNP) nmole mg-1 protein min-1. The averages of the GUS activity and the standard deviations of the experiment were derived from three independent assays of tobacco leaf extracts. The significance of GUS activity differences relative to empty vector values as determined by Student’s t-test analysis is indicated here with asterisks (∗P < 0.05).
