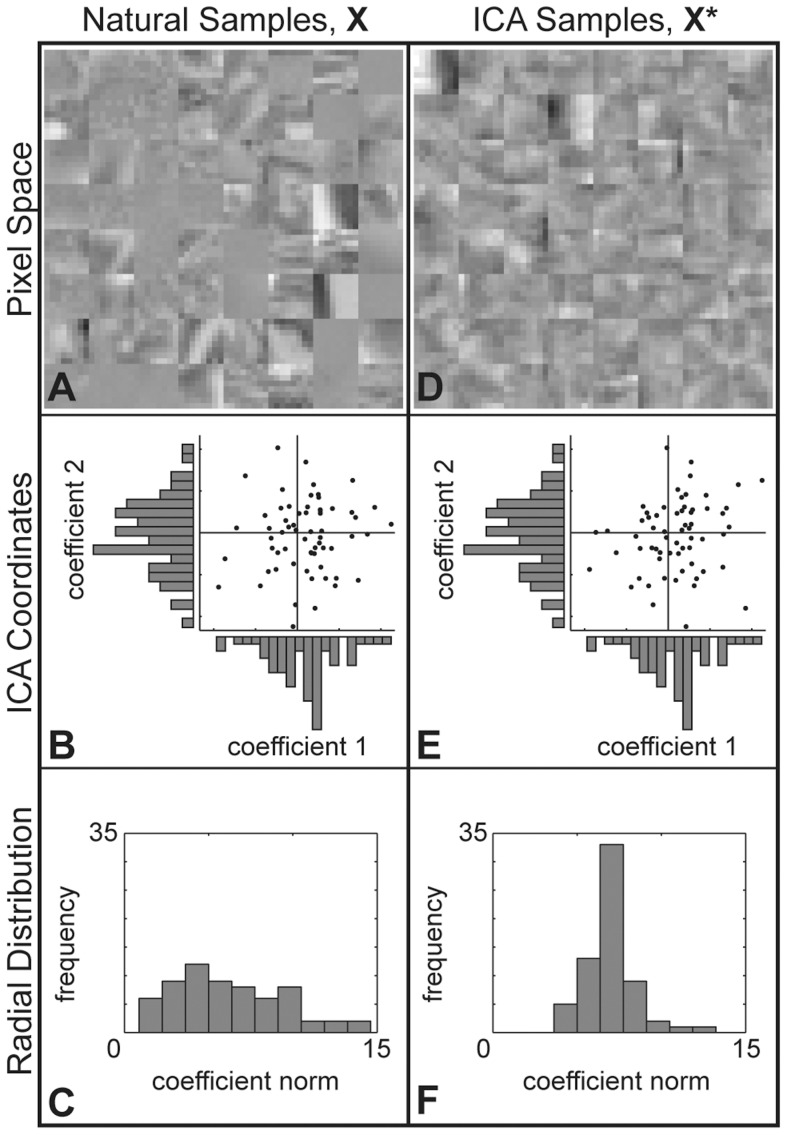
Figure 3. Generating model samples using ICA.
A. A set of 64  pixel natural image patches,
  . B. The coefficients of the first two (non-DC) ICA components are plotted against each other for all 64 patches along with their marginal distributions. C. Histogram of the 64 patches' norms in the ICA basis. D. To apply the ICA independence assumption to
  , we shuffle the ICA coefficients across samples separately for each component. Shown are the resulting matched model patches,
  . E. The coefficients of the first two (non-DC) ICA components of
  . The marginal distributions are the same as those of
  shown in B. F. Histogram of the coefficient norms of the 64 patches in
  . Applying the ICA assumption has changed the radial distribution so that the variance is much lower than that of the original distribution shown in C.

