
Figure 5. Experiment 1 results.
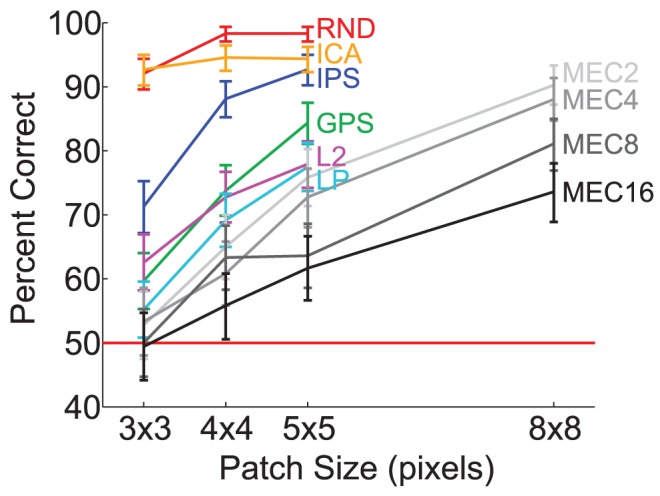
Discriminability estimates with 95% binomial confidence intervals are shown by model as a function of patch size, where data are pooled over subjects. Sixteen subjects participated in session one with RND, ICA, L2, LP, IPS, and GPS, and 12 participated in session two with the MEC models. Each subject performed 30 test trials per data point in the plot. Therefore, each data point for session one is based on  trials, and each for session two is based on
  trials.