
Figure 6. Model discriminability and likelihood.
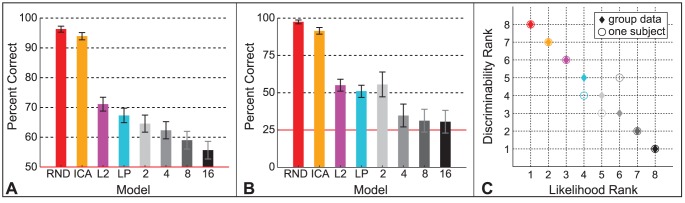
A. Discriminability estimates with 95% binomial confidence intervals plotted in order of increasing model likelihood. Data is pooled over subjects and patch sizes  ,
,  , and
, and  pixels. Each data point for RND, ICA, L2, and LP contains 1,440 trials, and 1,080 trials for the MEC models. MEC models are identified by the number of mixtures. Chance performance was 50%. B. Discriminability estimates with 95% binomial confidence intervals for one subject who performed 5 sessions of a four alternative choice version of the experiment. Each data point for RND, ICA, L2, and LP contains 576 trials, and 144 for the MEC models. Chance was 25%. C. Discriminability ranks of the models from most difficult to easiest are plotted against likelihood ranks from lowest likelihood to highest. Diamonds show group average data from A, and circles show the individual subject's data from B. The group data contain more trials and show a clear decrease in discriminability with increased likelihood. The same order is shown in the individual subject data within the range of the 95% confidence intervals, which overlap for L2, LP, and MEC
  .
.