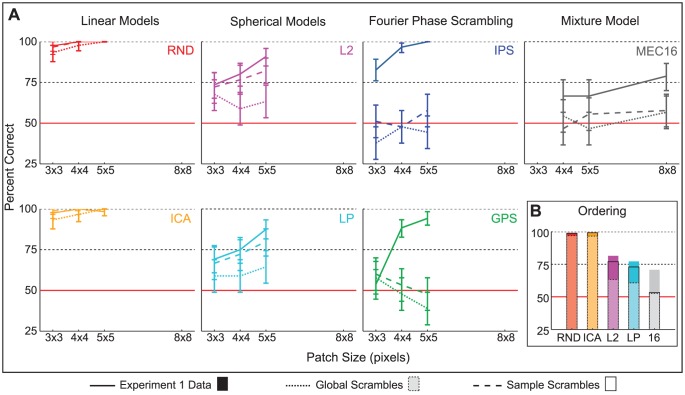
Figure 8. Experiment 2 results.
A. Discriminability estimates with 95% binomial confidence intervals are shown by model as a function of patch size. Three subjects participated, and each performed 30 test trials per model per patch size per condition, so each data point is based on  trials. We did not measure discriminability for MEC
  with
with  pixel patches as observers were at chance with them in Experiment 1. The solid line shows these observers' data in Experiment 1, i.e. with unperturbed stimuli, the dotted line shows performance for global scrambles, and the dashed line for sample scrambles. B. Discriminability estimates averaged over patch size for each model are plotted in order of increasing likelihood. The colored bars are the data from Experiment 1, the translucent bars with dashed edges are for the global scrambles, and the bars with solid edges are for the sample scrambles. In all three conditions, the ordering is the same: higher likelihood is linked with lower discriminability.

