
Figure 10. Experiment 3 results.
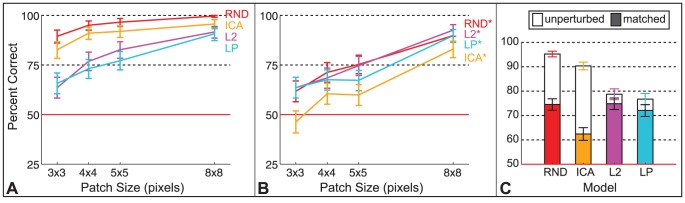
Discriminability estimates are plotted with 95% binomial confidence intervals. Nine subjects participated, and each performed 36 test trials per model per condition per patch size, so each data point in A and B is based on  trials. MEC, IPS, and GPS were not included in the experiment because they perfectly captured the contrast fluctuation cue in Experiment 2. A.
Results from the unperturbed stimulus condition. B.
Results from the contrast fluctuation matched stimulus condition. C. Discriminability estimates pooled over patch sizes and plotted in order of increasing model likelihood. The unfilled bars are for the unperturbed stimulus data in A, the filled bars for the data in B. As expected the model ordering for the data in A are the same as in Experiment 1, but the model ordering changed for the contrast fluctuation matched data, showing that
trials. MEC, IPS, and GPS were not included in the experiment because they perfectly captured the contrast fluctuation cue in Experiment 2. A.
Results from the unperturbed stimulus condition. B.
Results from the contrast fluctuation matched stimulus condition. C. Discriminability estimates pooled over patch sizes and plotted in order of increasing model likelihood. The unfilled bars are for the unperturbed stimulus data in A, the filled bars for the data in B. As expected the model ordering for the data in A are the same as in Experiment 1, but the model ordering changed for the contrast fluctuation matched data, showing that  brought performance closest to chance out of all models whereas ICA was near ceiling with the unperturbed stimuli.