
. 2012 Dec 11;3:17. doi: 10.1186/2040-2392-3-17
Copyright ©2012 Auyeung et al.; licensee BioMed Central Ltd.
This is an Open Access article distributed under the terms of the Creative Commons Attribution License ( http://creativecommons.org/licenses/by/2.0), which permits unrestricted use, distribution, and reproduction in any medium, provided the original work is properly cited.
Figure 1.
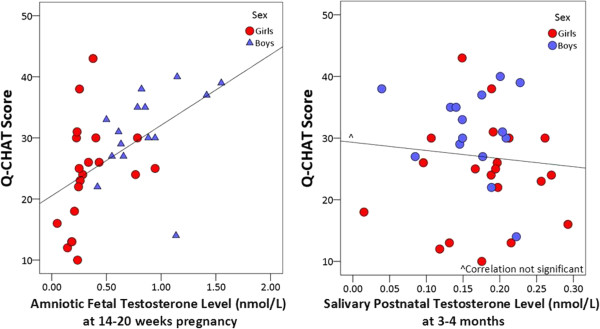
fT and pT levels and Q-CHAT scores.