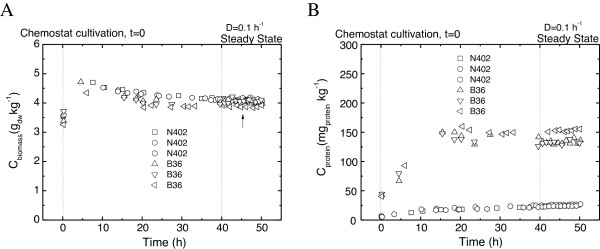
Figure 1.

Growth profiles (A) and extracellular protein production (B) of N402 and B36. The growth curves presented are based on (A) dry-weight biomass concentration and on (B) total protein concentration in culture filtrates. An arrow indicates RNA sampling for transcriptomics. All six independent cultures are shown.
