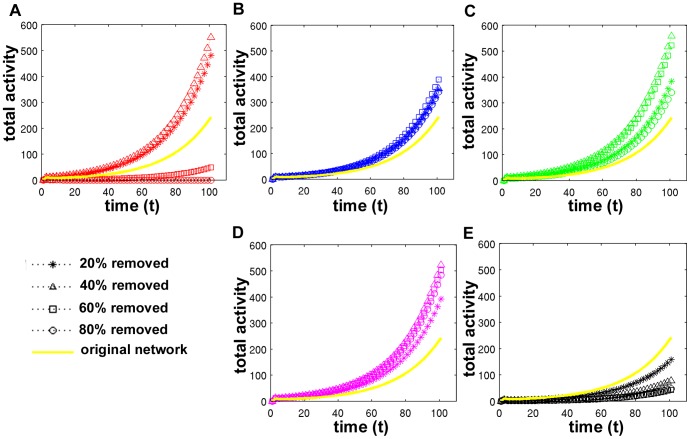
Figure 5. Total activity in the network after targeted attack and random failure in an example subject.
Nodes are targeted by degree (A), leverage (B), betweenness (C), and eigenvector centrality (D), as well as at random (E). Curves represent networks after removing 20% (stars), 40% (triangles), 60% (squares), and 80% of the network (circles). The total activity of the original network is shown in yellow for comparison.

